Understanding perfusion imaging, which is used in evaluation of acute stroke, particularly for purposes of patient triage vis-a-vis transarterial revascularization, begins with brief review of stroke physiology. All of the material presented here is simplified to achieve maximum clarity for those who have long ago stopped solving differential equations and integrating areas under curves — and so I ask the experts to cut this page some slack. As Einstein said, you have to be able to explain it to your grandma 🙂
For a comprehensive review, see excellent article in Radiographics, available free of charge:
http://radiographics.rsna.com/content/23/3/565.full
Bernd F. Tomandl, MD, Ernst Klotz, Dipl Phys, Rene Handschu, MD, Brigitte Stemper, MD, Frank Reinhardt, MD, Walter J. Huk, MD, K.E. Eberhardt, MD and Suzanne Fateh-Moghadam, MD Comprehensive Imaging of Ischemic Stroke with Multisection CT. Radiographics 2003; 23:565-592
Brain blood flow at baseline and stroke
Blood flow through an artery, or vascular bed, is determined by a simple relationship:
Flow = Pressure / Resistance, where resistance is mainly defined as inverse of vasodilatation — the more “open” the vascular bed, the less resistance
When an artery is occluded (thromboembolic stroke), flow to the corresponding vascular bed is decreased. To compensate for decreased flow, the body can only do two things — increase pressure, and decrease resistance.
flow = Pressure / Resistance
Pressure — more important than the actual number is the “effectiveness” of pressure. Systolic of 150 in a healthy 20-year-old is more effective than that of 220 in a vasculopath.
Resistance — resistance is decreased by vasodilatation, whereby both volume and inflow capacity of the vascular bed is increased, thus “drawing” blood into the area. The effectiveness of vasodilatation is the primary determinant of the “goodness” of leptomenineal collateral responce. Patients with healthy compliant arteries can effectively decrease resistance, whereas those with atherosclerotic (“hard” and noncompliant, by definition of atherosclerosis) vessels are not effective, and must rely more on increasing pressure.
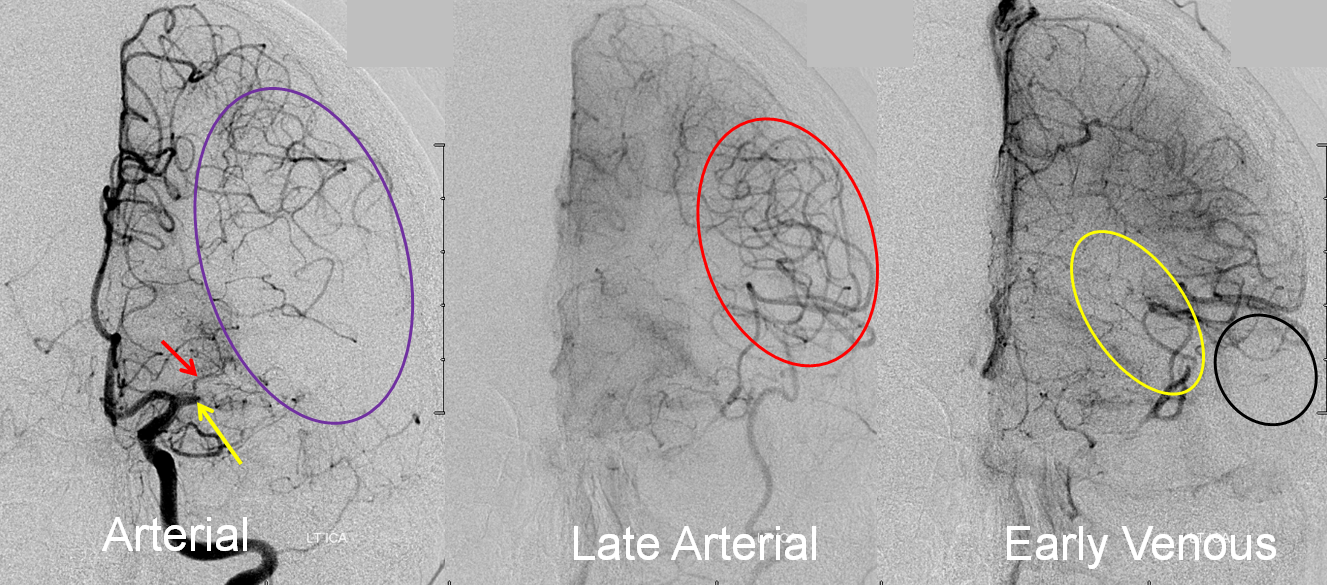
Collateral response can be seen angiographically as well as by perfusion. In this patient with left M1 occlusion (yellow arrow), the MCA territory (purple oval) is at risk. Notice patent lateral lenticulostriate branch (red arrow). In late arterial phase, due to robust leptomeningeal collaterals, a lot of MCA branches are retrogradely filling (red oval). In early venous phase, there is more filling of MCA territory, but some areas don’t look good, such as those of more distal M1 lenticulostriates (yellow oval) and the temporal pole (black oval).
Final territory of infarction, after revascularization, involves the blocked lenticulostriate, an area with ver very poor collaterals.
Perfusion Imaging — the aim is to provide a physiologic understanding of perfusion maps, beyond the simple “mismatch” concept, and therefore derive insight which will better guide therapeutic decision-making. Exaples are from CT perfusion. MRI perfusion measures basically the same things and generates basically the same maps, but is less widely available
The concept of perfusion is simple — a bolus of contrast is injected, and a pre-selected tissue area is repeatedly scanned while the bolus passes through it. Arrival of contrast into the brain increases “brightness” of the tissue, which is measured in Hounsfield Units (HU). Various curves are generated based on time, speed, extent, and duration of contrast presence within each volume of tissue (voxel). The basic measurements of perfusion are flow and volume, with additional various parameters such as time to peak, mean transit time, time to drain, and others being provided by different equipment and software developers. Here is a typical perfusion curve:
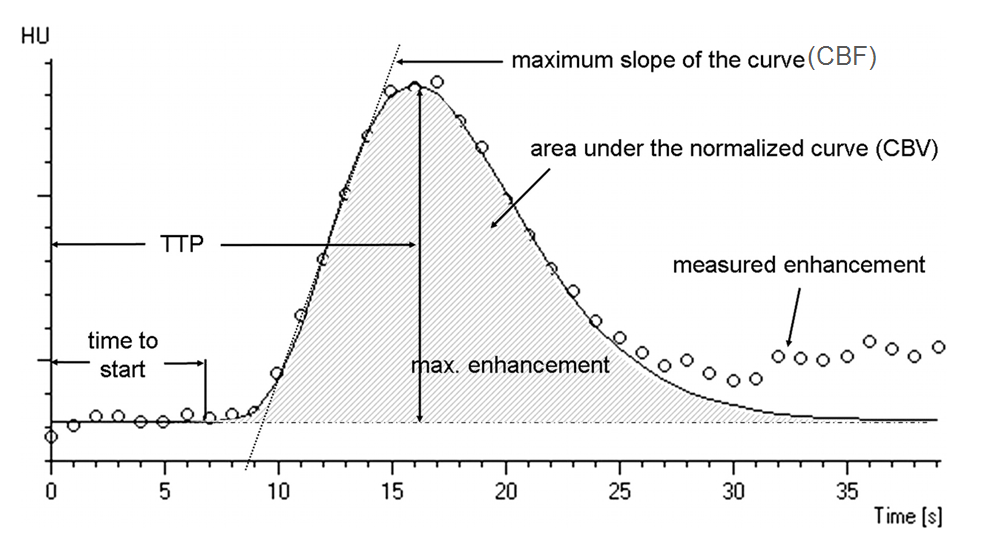
Image modified from Radiographics article referenced above.
Time to Start is rarely used; Time to Peak (TTP) is a very sensitive measure of decrease in flow — it takes longer for contrast to arrive into an area where the primary road is blocked than into an area where the direct arterial pathway is open; cerebral blood flow (CBF) is the slope of the curve as contrast arrives into the brain — the more vertical the slope, the faster the flow (areas perfused by collateral vessels have slower, less robust inflow); CBV is the volume under the curve — the total amount of contrast that was present in the tissue over time of measurement (this is, crudely, a measure of whether or not blood actually gets where it needs to go, even if at a slower pace). Volume is related to flow through the parameter of Mean Transit Time (MTT) — you can have slow inflow, but over time greater total volume.
Ischemic stroke, from major branch occlusion, for example, results in the following changes:
Time to peak is ALWAYS prolonged. It takes longer for blood to get to the affected area than to normal area if the direct route is blocked.
Flow is usually prolonged, but not always. Pressure and resistance adaptations may be so effective as to keep flow at or near baseline (the slope of the curve stays about the same) — which is why Time to Peak is more sensitive than flow. On the other hand, if flow is normalized, the area might do well even without pharmacologic or mechanical reperfusion.
Volume is variable, and not as intuitive. The volume that’s measured is NOT volume of blood in voxel per se, but rather volume of contrast bolus over some defined measurement time. Volume of blood in dead brain is actually high, but as the area has no inflow, no contrast gets in, and so measured volume is low. The adaptive response to occlusion is decreasing resistance, which means means increasing vascular bed capacitance (i.e. vasodilatation), which means increase in total volume. Effective collateral adaptation can result in increase in total volume (CBV) measurement within the affected territory (see example below). Alternatively, poor collateral responce means less effective inflow, and overall decrease in volume. Whatever the case, low CBV is always bad news. The following examples will illustrate these points:
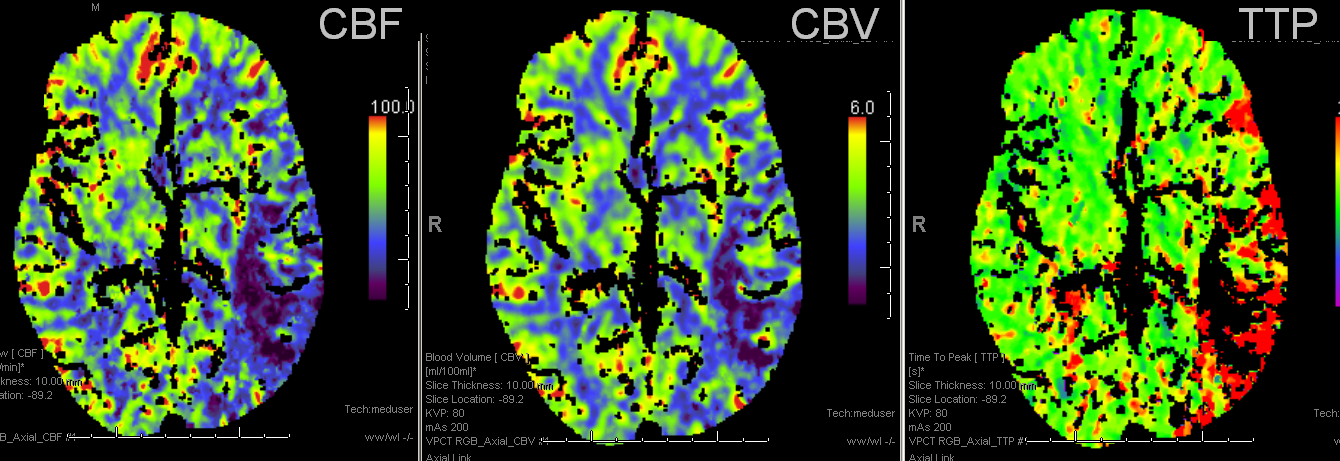
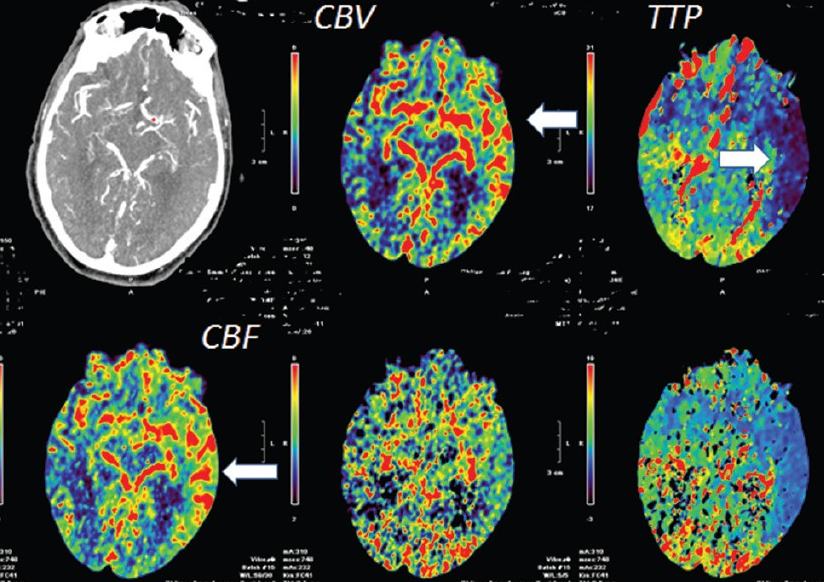
A study of typical stroke perfusion maps and corresponding curves is essential. Patient presents with a full left MCA syndrome.
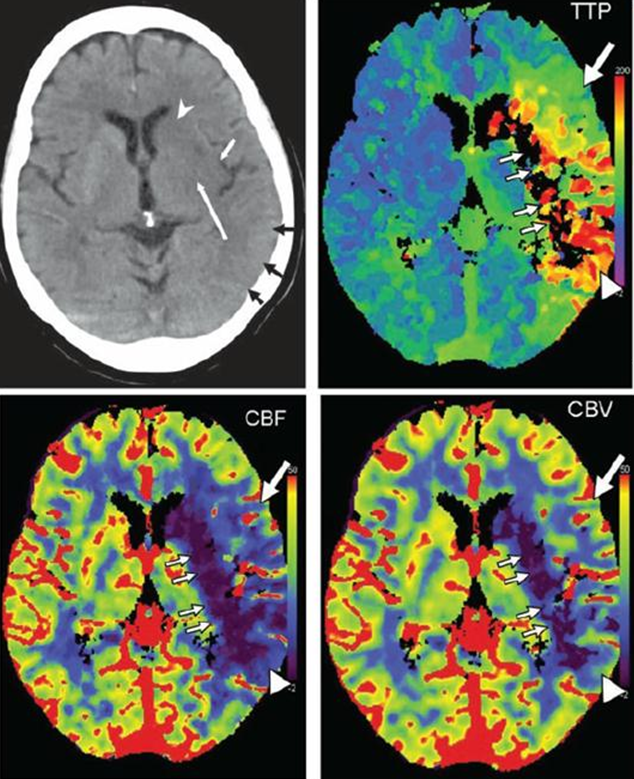
Image modified from Radiographics article referenced above.
Typical pefusion maps. Knowing color scale is key.
For TTP, higher scale (red) means longer TTP (bad), and lower scale (blue) means shorter TTP (good).
For CBF, higher scale (red) means faster flow (good), and lower scale (blue) means less flow (bad).
For CBV, higher scale (red) means more volume (generally good), and lower scale less volume (generally bad)
So, not all red is bad, and not all blue is bad. Besides, different manifacturers use different color scales. So it is better to think physiologically than to try to remember which colors are which.
Perfusion curves of various points are shown: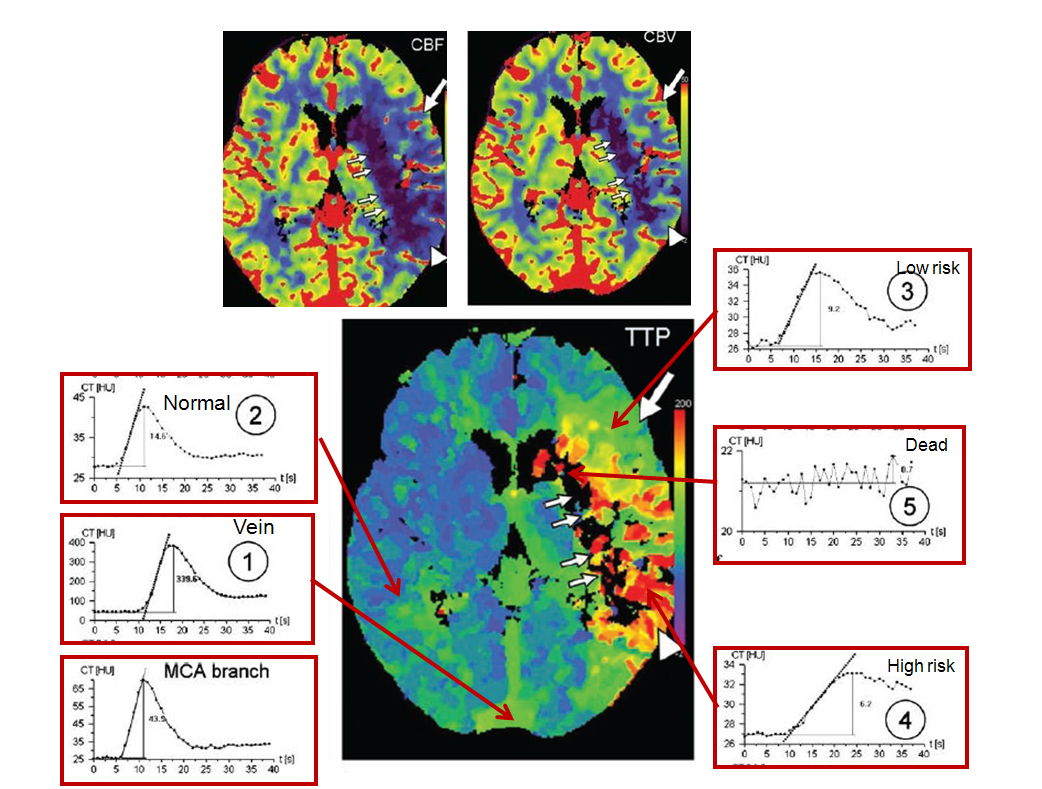
Image modified from Radiographics article referenced above.
x-axis is time, and y-axis is Hounsfield units (brightness of voxel)
1. MCA branch: “fast” arrival time (5 seconds) and “tight” curve, with washout complete by 20 seconds
2. Vein: slower arrival (10 seconds), very high enhancement (y-axis, 400 HU), and slower washout
3. Normal: looks a lot like “MCA branch”, with somewhat lower HU (~45), and more contrast remaining in the tissue after washout (past 20 seconds) — this remaining contast, BTW, is what’s measured as “enhancement”
4. Low risk: decreased flow (slope of curve is less steep), increased time to peak (x-axis: 16 seconds rather than ~12 sec for normal brain), and about the same volume (area under curve). Notice that contrast gets in slower and stays longer — the washout phase is prolonged
5. High risk: even slower flow, more gentle slope, longer time to peak (24 seconds), and much longer whashout phase — by 40 seconds, a lot of contrast is still there. Why does the “CBV” map show decreased volume then? Because the volume is not measured over 40 seconds, but perhaps over 20 or 30, depending on how the software reconstruction is set up. That’s the key to understanding CBV
6. Dead brain — black holes on all maps — there is no curve, because contrast can’t get there at all
With this in mind, lets look at some more examples:
A man with history of aortic valve replacement, therapeutic on Coumadin, presents with acute left-sided weakness. CT shows a new “dense right MCA sign”

CTA shows new complete occlusion of the right MCA at M1 terminus distal to the lenticulostriate vessels.

CT perfusion raw data shows delayed evantual arrival of the contrast bolus into the right MCA territory (blue oval)

Perfusion maps confirm presence of large right MCA territory penumbra — delayed Mean Transit Time and Time to Drain (roughly the same significance as time to peak), reduced CBF, and mainated CBV

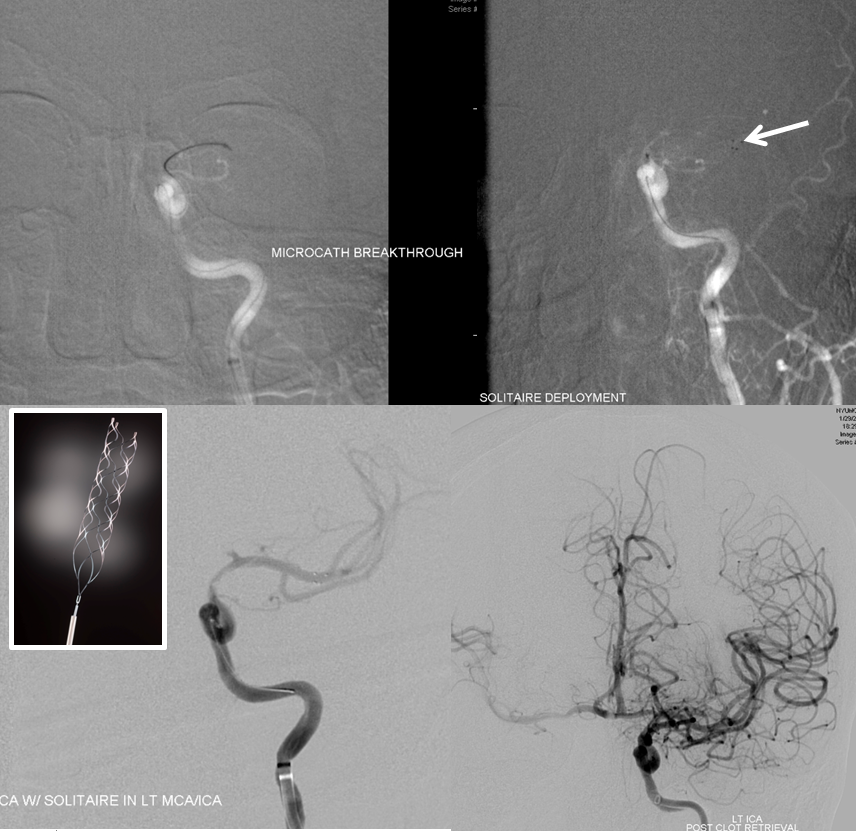
Solitaire device is placed accross the occluded segment and removed, uncharacteristically not capturing the entire throbus, which is then removed by aspiration with a 5 Maxx ACE catheter.

Post-procedure diffusion MR shows no ischemia, due to combination of both patient selection and technical success.

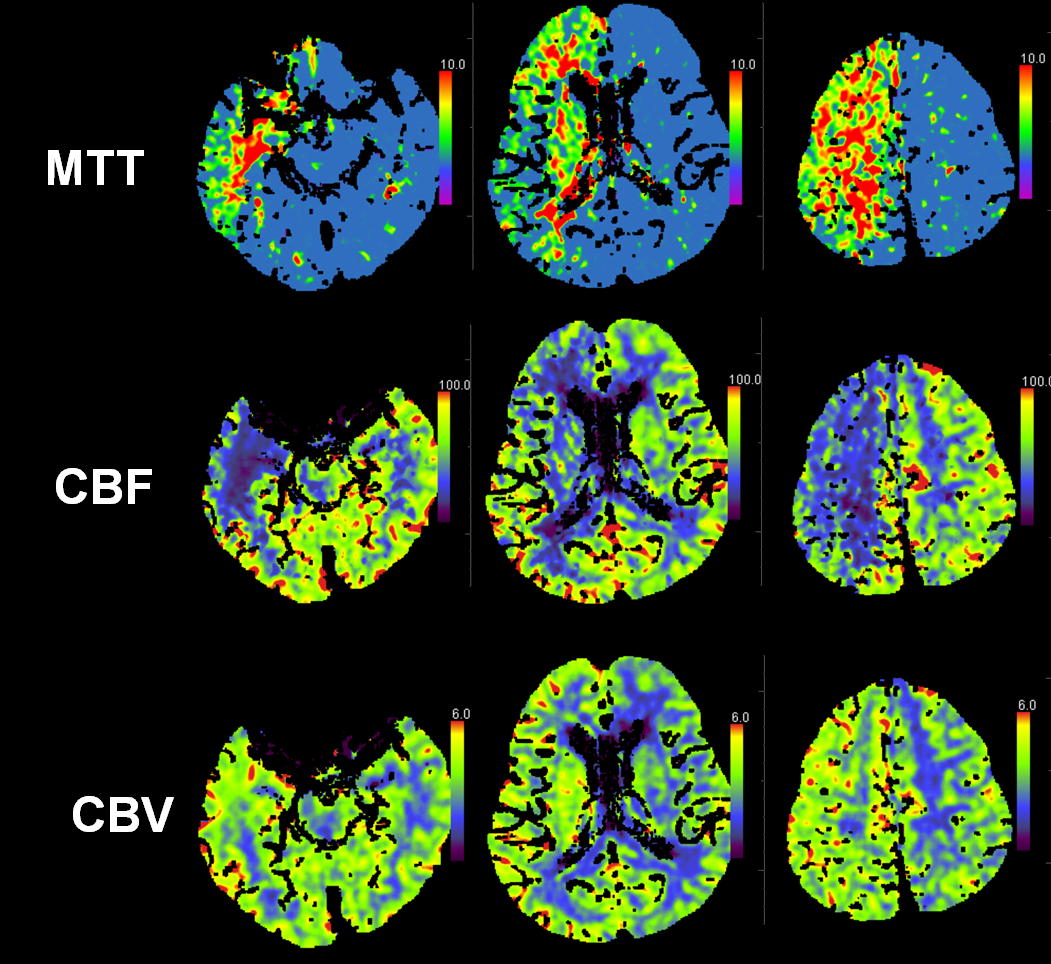
A different case:
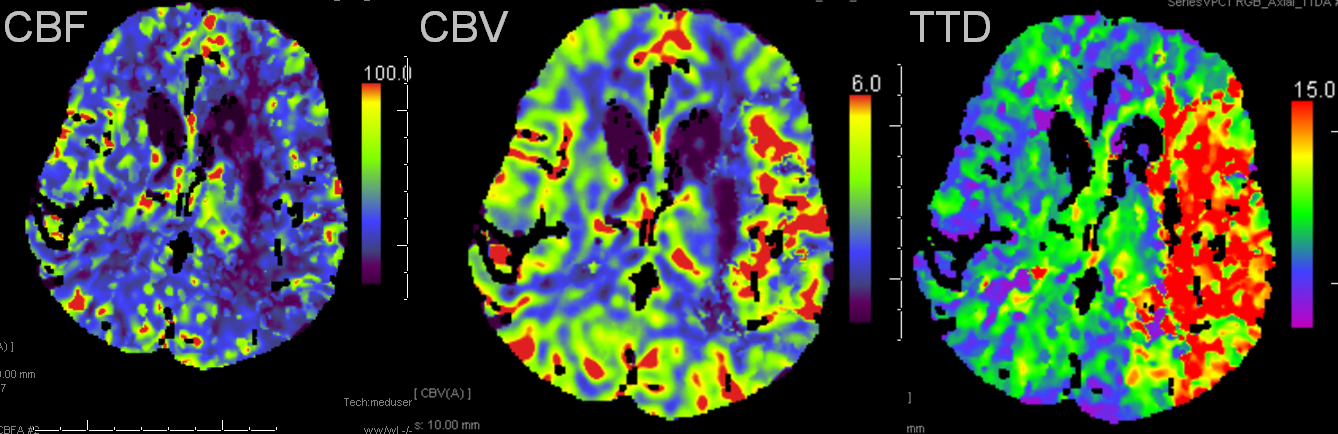
Left MCA syndrome. TTD is time to drain, which for all purposes is similar to TTP, showing decreased flow in entire MCA territory. Notice a small black hole in the lateral lenticulostriate area, probably external capsule. CBF is down in the lenticulostriate area, but relatively good over the temporal lobe. CBV is increased — a key factor — implying that temporal lobe vascular bed has vasodiated effectively, thereby increasing its volume and almost normalizing temporal lobe CBF. This is generally a great situation to be in. Those who look for simple “mismatch” between CBV and CBF or TTP, may be confused by increased volume, whereas physiologic understanding clarifies the situation.
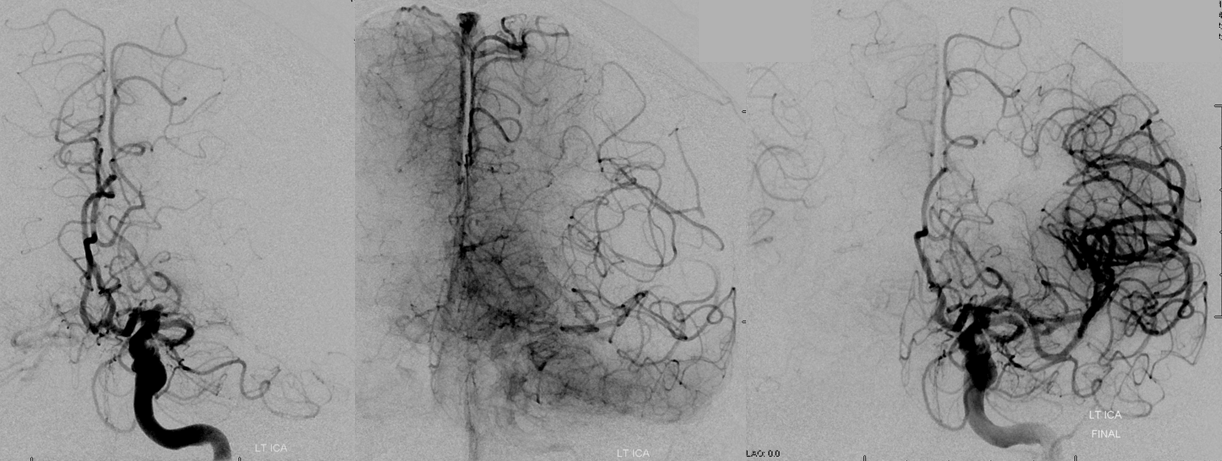
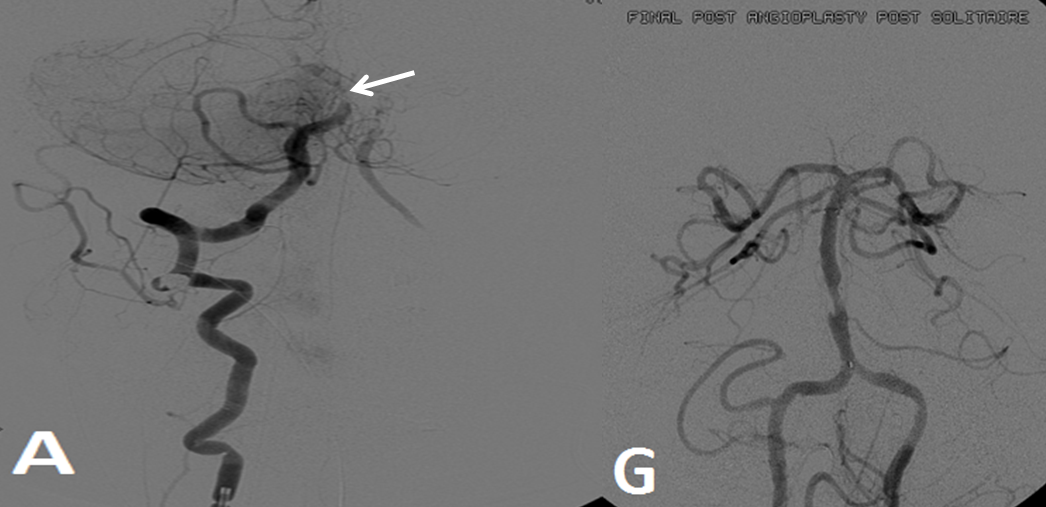
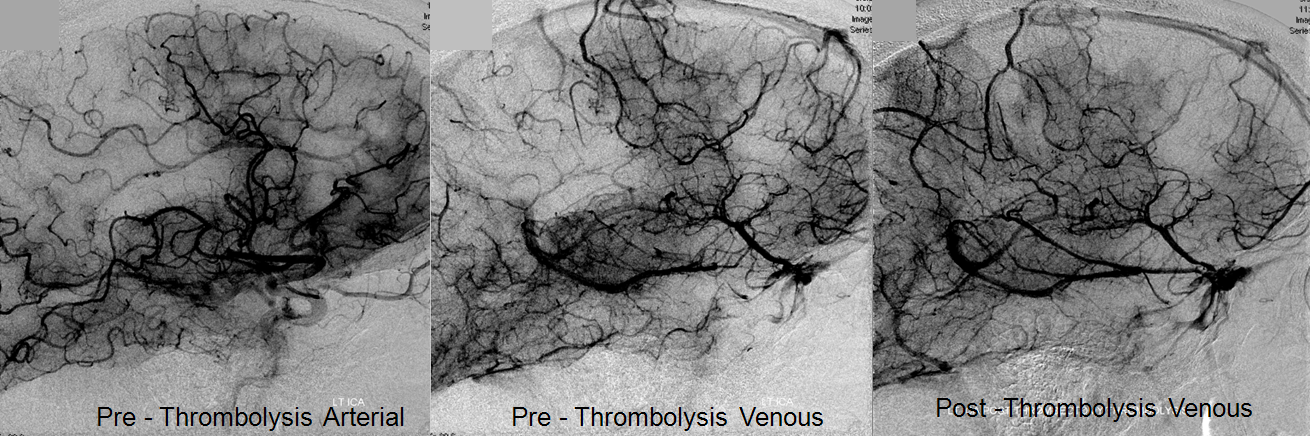
Pre-reperfusion (left and center) and post-reperfusion frontal projection angiographic views, showing marked post-reperfusion dilatation of MCA branches beyond the occlusion. This is the basis of the “reperfusion hemorrhage” — sudden increase of flow into an area which has done everything it can to maximize collateral perfusion, instantaneously re-flooded by opening the primary pathway. Especially critical if the brain beyond the occlusion has suffered an infarct, which damages mechanisms of perfusion control, so that vessels remain dilated and friable.
Another case: Left MCA branch occlusion
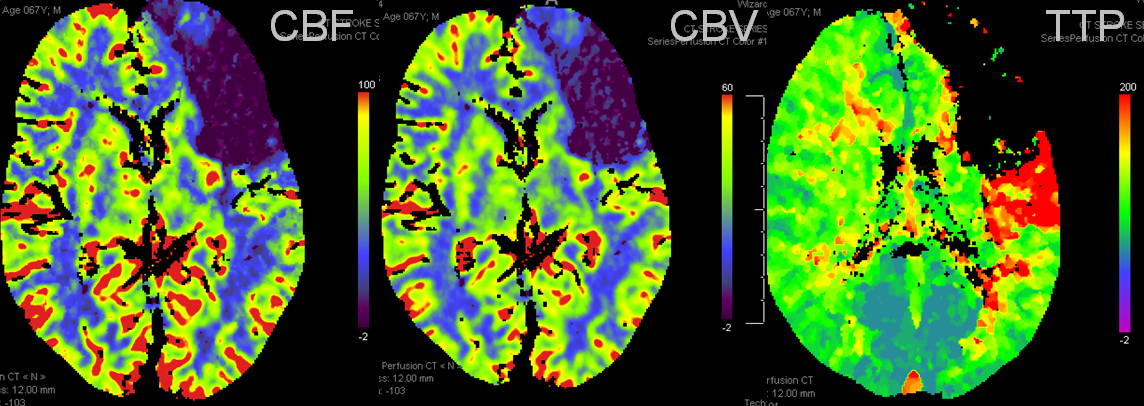
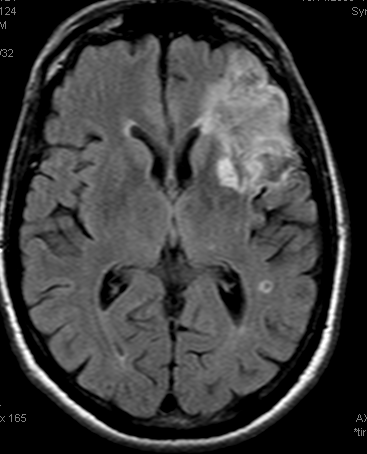
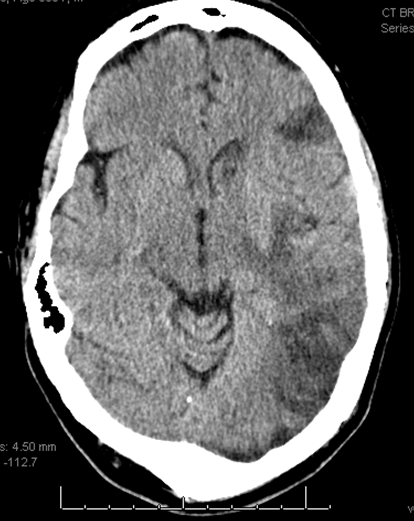
Bad news: Black hole in frontal lobe on CBF, CBV, and TTP. This brain is completely unsalvageable. Temporal lobe is another story. TTP is red (prolonged), which means there is proximal occlusion somewhere. However, CBF and CBV are normal — which means that adaptive pressure/resistance responce has normalized speed of flow, and the measured volume is about normal. This area may well survive without either mechanical or pharmacologic revascularization, as it in fact did. Infarct shown below spares the temporal lobe.
Example 3: Partial left MCA syndrome.
TTP is high, with a big hole in posterior temporal and inferior parietal lobes. Another area at risk is lateral frontal convexity. CBF is down, and CBV is down. Low CBV is usually bad news, no matter what. This is a situation of “no mismatch”. The patient was taken to angio based on timing of onset (groin puncture within 1.5 hours of sympom onset, followed by quick revascularization of parietal lobe less than 30 min later)
Pre and post images demonstraing re-vascularization of the parietal lobe. Middle frontal lobe and motor strip area remain down despite best efforts.
Final infarct zones match original perfusion images, attesting to clincal ineffectiveness of revascularization in setting of decreased CVF and CBV (matched defect)
Carotid Occlusion
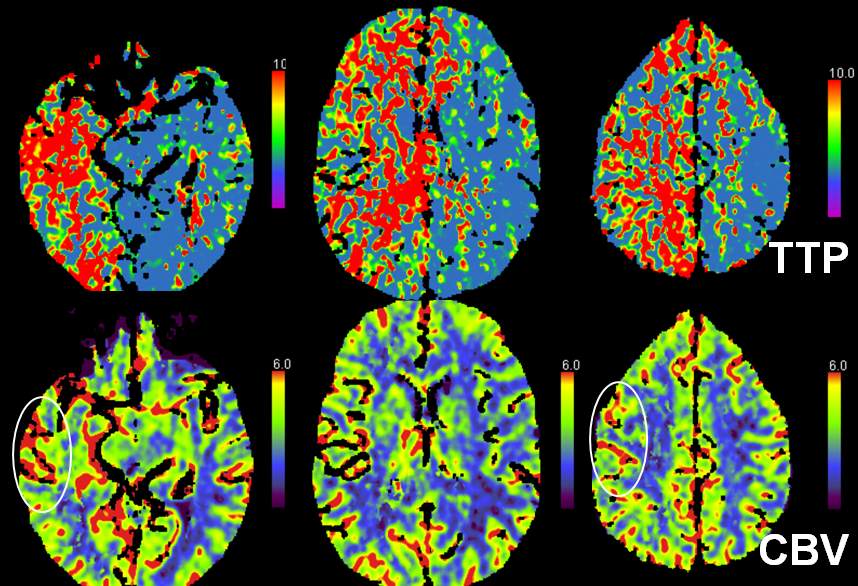
This patient presented with left-sided weakness in setting of systemic hemorrhage-related hypotension. Perfusion shows a large area of decreased flow, increased Time To Peak, and slightly increased CBV. The physiology here makes sense for a proximal (such as cervical carotid bifurcation) disease. Decreased flow and increased TTP reflect delayed inflow into right hemisphere vasculature through collateral routes. Increased CBV is consistent with physiologic vasodilatation in the “at-risk” territory, in effort to decrease its vascular resistance and thereby increase inflow.
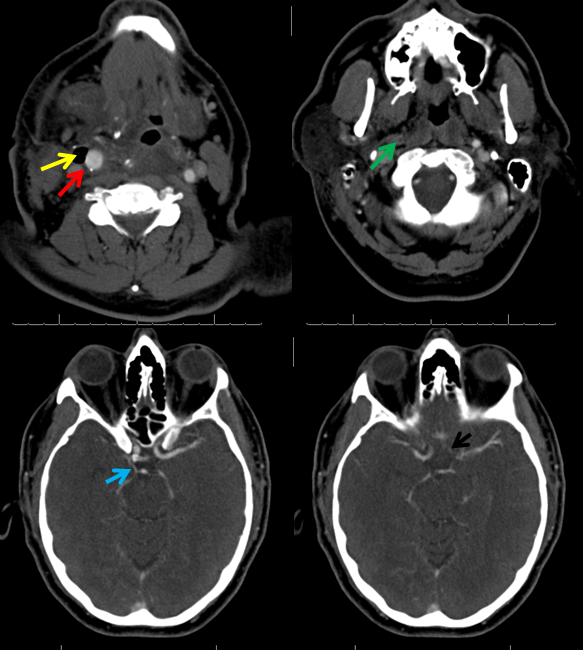
CT angiogram shows occlusion of the right cervical ICA. There is no intracranial stenosis or occlusion. A nice basilar fenestration was identified, however (black arrows)
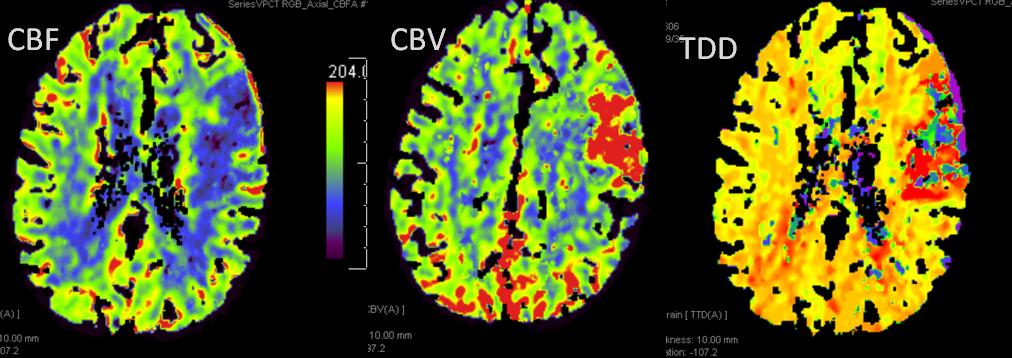
Increased CBV and CBF, and decreased TTP (faster arrival of bolus), all due to vasodilatation in area of seizure involving the left hemisphere.
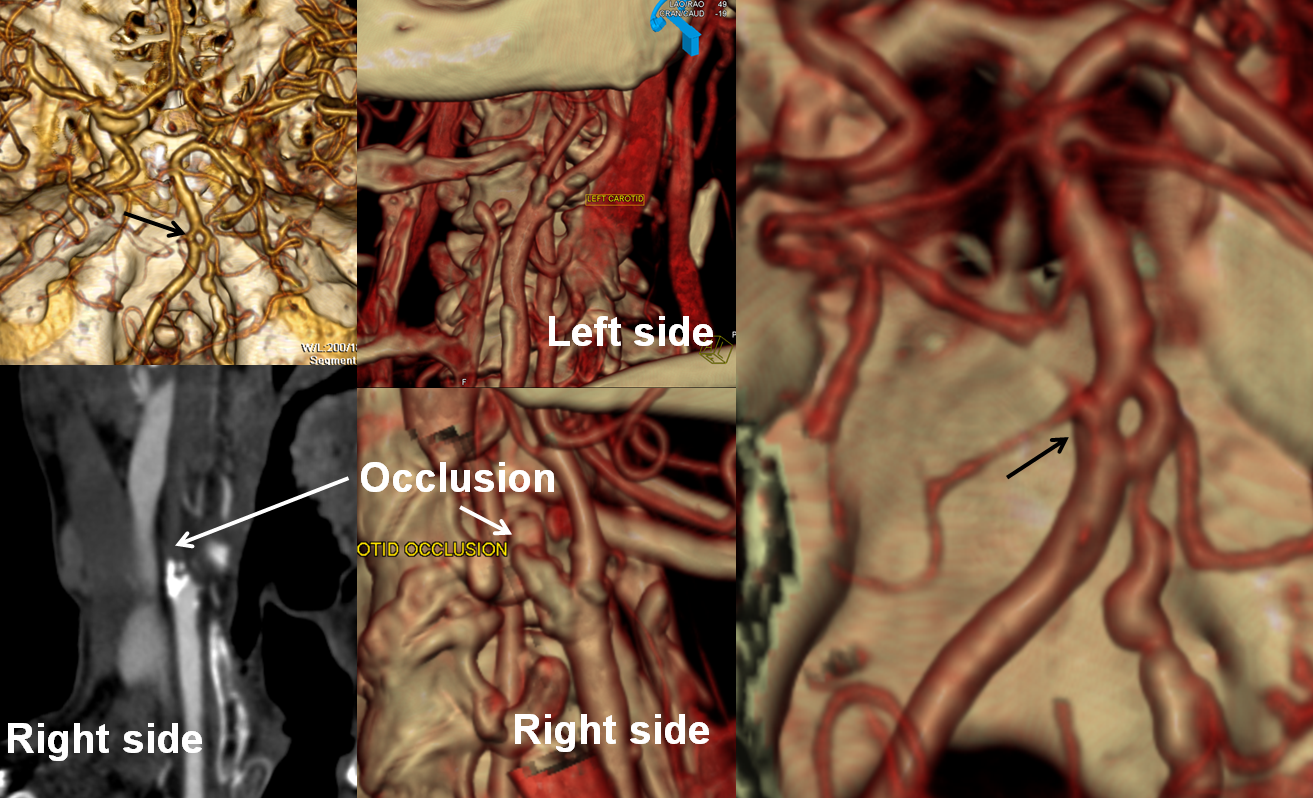
Another case of carotid occlusion. This patient has a “trapped” circulation — the circle of Willis is incompetent. On the right, a fetal PCOM and a dominant A1 are present — which means that the right ICA supplies both right PCA and left ACA territories — more than half of the entire hemisphere. Unfortunately, this ICA goes down. The brain is hanging on by a thread — a tiny right P1 segment, maximial ECA-ICA anastomoses, MCA-ACA-MCA leptomeningeal collaterals, etc. Notice the enormous at-risk territory identified by red hues on TTP imaging. The CBV is barely increased compared with the left MCA territory — in light of dramatic TTP maps, this barely above-the-board CBV attests to the precarious nature of the situation. The patient’s pressure has been increased to 190 systolic to make this happen.
CTA demonstrating a small P1 segment (light blue) and a tiny left A1 (black). The superior cervical ICA is occluded (green) above a freshly-made endarterectomy. Notice post-surgical patuous dilatation of the bulb (red) and adjacent air (yellow)
Case of very early perfusion imaging:
This patient underwent perfusion imaging within 30 minutes of symptom onset. CBF is low, yet CBV is very high. Its is unusual to see such a big discrepancy — essentially implying that despite severely reduced inflow (CBF), the tissue is still able to not only normalize but increase its total measured volume (CBV). It would seem that the situation is favorable. The artery was mecanically opened (Solitaire) within the next hour, less than 2 hours from symptom onset, yet final infarct was completely matched to the area of occlusion (CT scan below). It may be that the scan was obtained early enough, when the brain was still alive, or perhaps not, but its vascular bed continued to allow for slow inflow. Either way, some suggest that perfusion might not be as reliable when obtained very early in the ictus, as this case illustrates.
Seizure — occasionally mimics stroke. There is increased CBV and CBF, and decreased TTP (faster arrival of bolus), all due to vasodilatation in area of seizure involving the left hemisphere.
In general, any situation where the suspected region of abnormality has decreased, rather than increased TTP, or MTT, or CBF can not possibly be suffering from proximal occlusion, the hallmark of which is decreased flow and prolonged bolus arrival times. Either perfusion study is somehow invalid (reconstruction error) or it is not a stroke.
Image courtesy of: Vishnumurthy Shushrutha Hedna, Prerak P Shukla, Michael F Waters. Seizure Mimicking Stroke: Role of CT Perfusion. J Clin Imaging Sci 2012, 2:32 http://www.clinicalimagingscience.org/article.asp?issn=2156-7514;year=2012;volume=2;issue=1;spage=32;epage=32;aulast=Hedna
Interventional Treatment of Stroke – an overview
Ischemic stroke makes up about 85% of all strokes in North America, Europe, and the Australian Continent. Stroke statistics are a very interesting subsection of health statistics in general.
U.S. Statistics — from http://www.strokecenter.org/patients/about-stroke/stroke-statistics/

Stroke is the third leading cause of death in the United States. More than 140,000 people die each year from stroke in the United States.
- Stroke is the leading cause of serious, long-term disability in the United States.
- Each year, approximately 795,000 people suffer a stroke. About 600,000 of these are first attacks, and 185,000 are recurrent attacks.
- Nearly three-quarters of all strokes occur in people over the age of 65. The risk of having a stroke more than doubles each decade after the age of 55.
- Strokes can and do occur at ANY age. Nearly one fourth of strokes occur in people under the age of 65.
- Stroke death rates are higher for African-Americans than for whites, even at younger ages.
- On average, someone in the United States has a stroke every 40 seconds.
- Stroke accounted for about one of every 17 deaths in the United States in 2006. Stroke mortality for 2005 was 137,000.
- From 1995–2005, the stroke death rate fell ~30 percent and the actual number of stroke deaths declined ~14 percent.
- The risk of ischemic stroke in current smokers is about double that of nonsmokers after adjustment for other risk factors.
- Atrial fibrillation (AF) is an independent risk factor for stroke, increasing risk about five-fold.
- High blood pressure is the most important risk factor for stroke
The total number of strokes and stroke deaths is increasing due to incrased longevity of the North American populace. Stroke is now the third leading cause of death in the U.S.A.
Roughly 25% of ischemic strokes are small vessel occlusions, about 25% are embolic.
http://emedicine.medscape.com/article/1160370-overview