
Lets be very clear here. Angiography — both 2D and 3D — is an art. To get beautiful images — which is art — you must be an artist. This applies to both 2D and 3D. Since 3D images are made from a series of 2D images, it follows that when 2D technique is bad, 3D images will be bad or worse. See The Art of Angiography page for more principles and practice info.
There are three key elements to getting good 2D and 3D images. They are, in order of importance — patient, injection, and machine. When technique is good, you will get excellent images on a machine 2 generations old.
The two main problems with bringing high end cone beam CT images into standard practice are 1) suboptimal acquisitions / imaging techniques and 2) lack of automation. This section is dedicated to obtaining images of excellent quality. However, once these images are obtained, even at that point there is still lack of automation in maximizing their yield. We need “secondary reconstructions” and other manipulation to get there. This will hopefully improve with time. However, good 2D and 3D angiographic technique will remain necessary as no amount of “motion correction” and other crutches will help compensate for poor quality raw data. We now discuss elements of what constitutes good technique.
PATIENT
The patient needs to be optimally positioned — straight — and still. The more movement, the worse 2D and 3D images. Moderate sedation usually leads to the worst images since patients tend to move a lot and can’t follow directions. A cooperative patient with minimal sedation can hold still enough to get excellent 4-7 second duration images. Longer injections, especially in the vert (dizziness), can be quite uncomfortable.
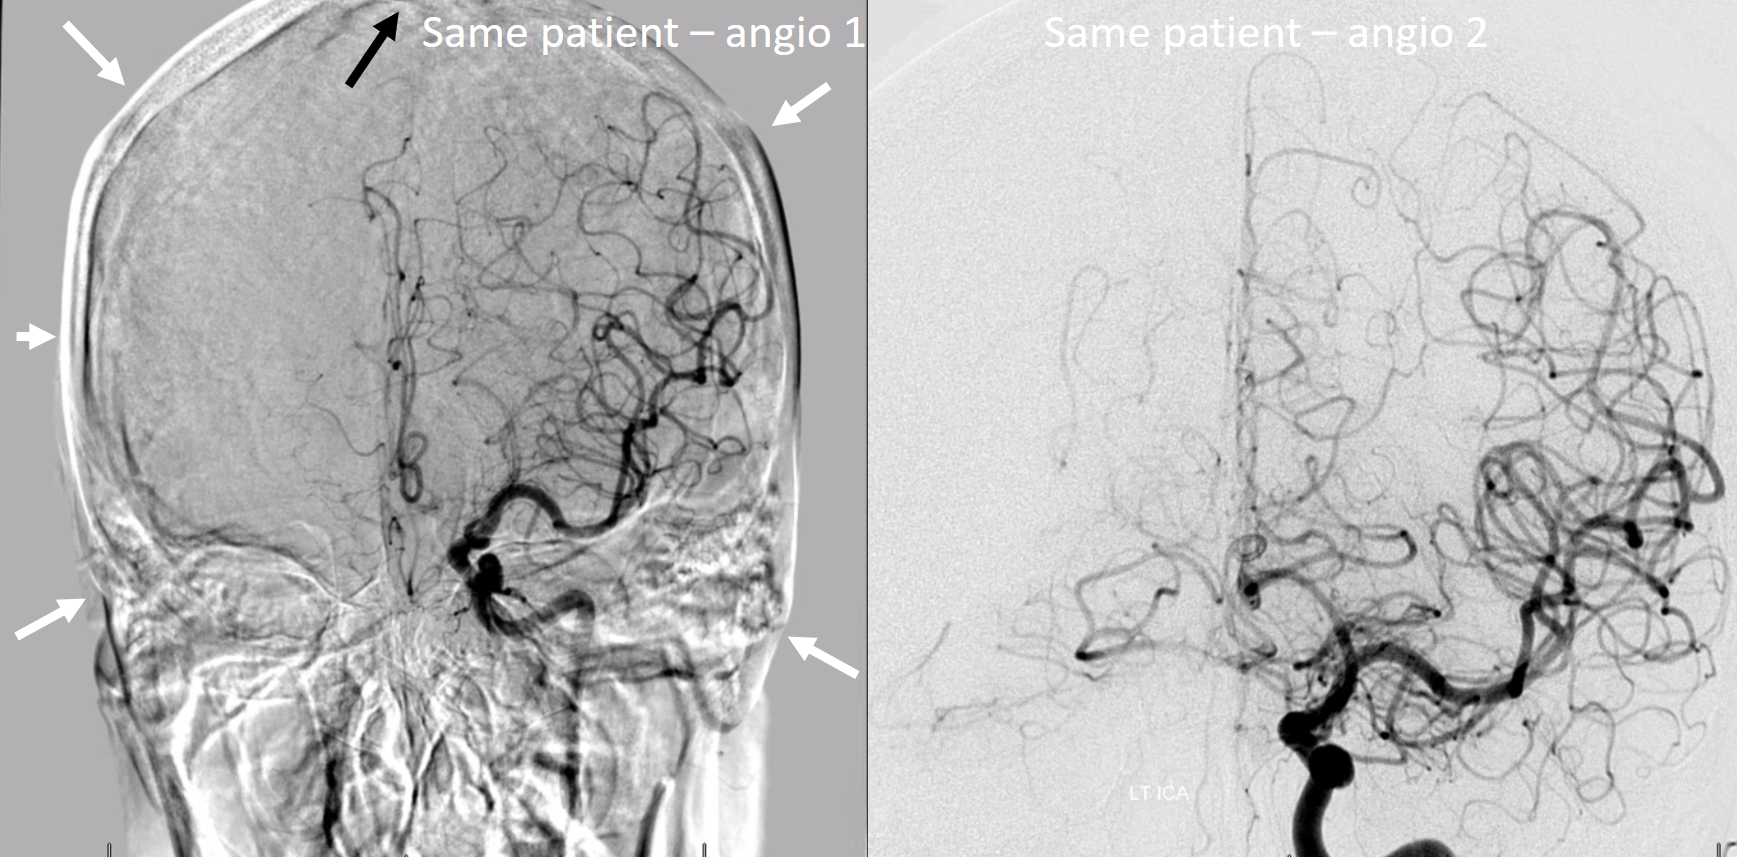
The best is general anesthesia, with pharmacologic paralysis, and breath hold — apnea. Make sure there is pharmacologic paralytic on board and ask for apnea. Below is an example of the same patient imaged suboptimally and optimally.
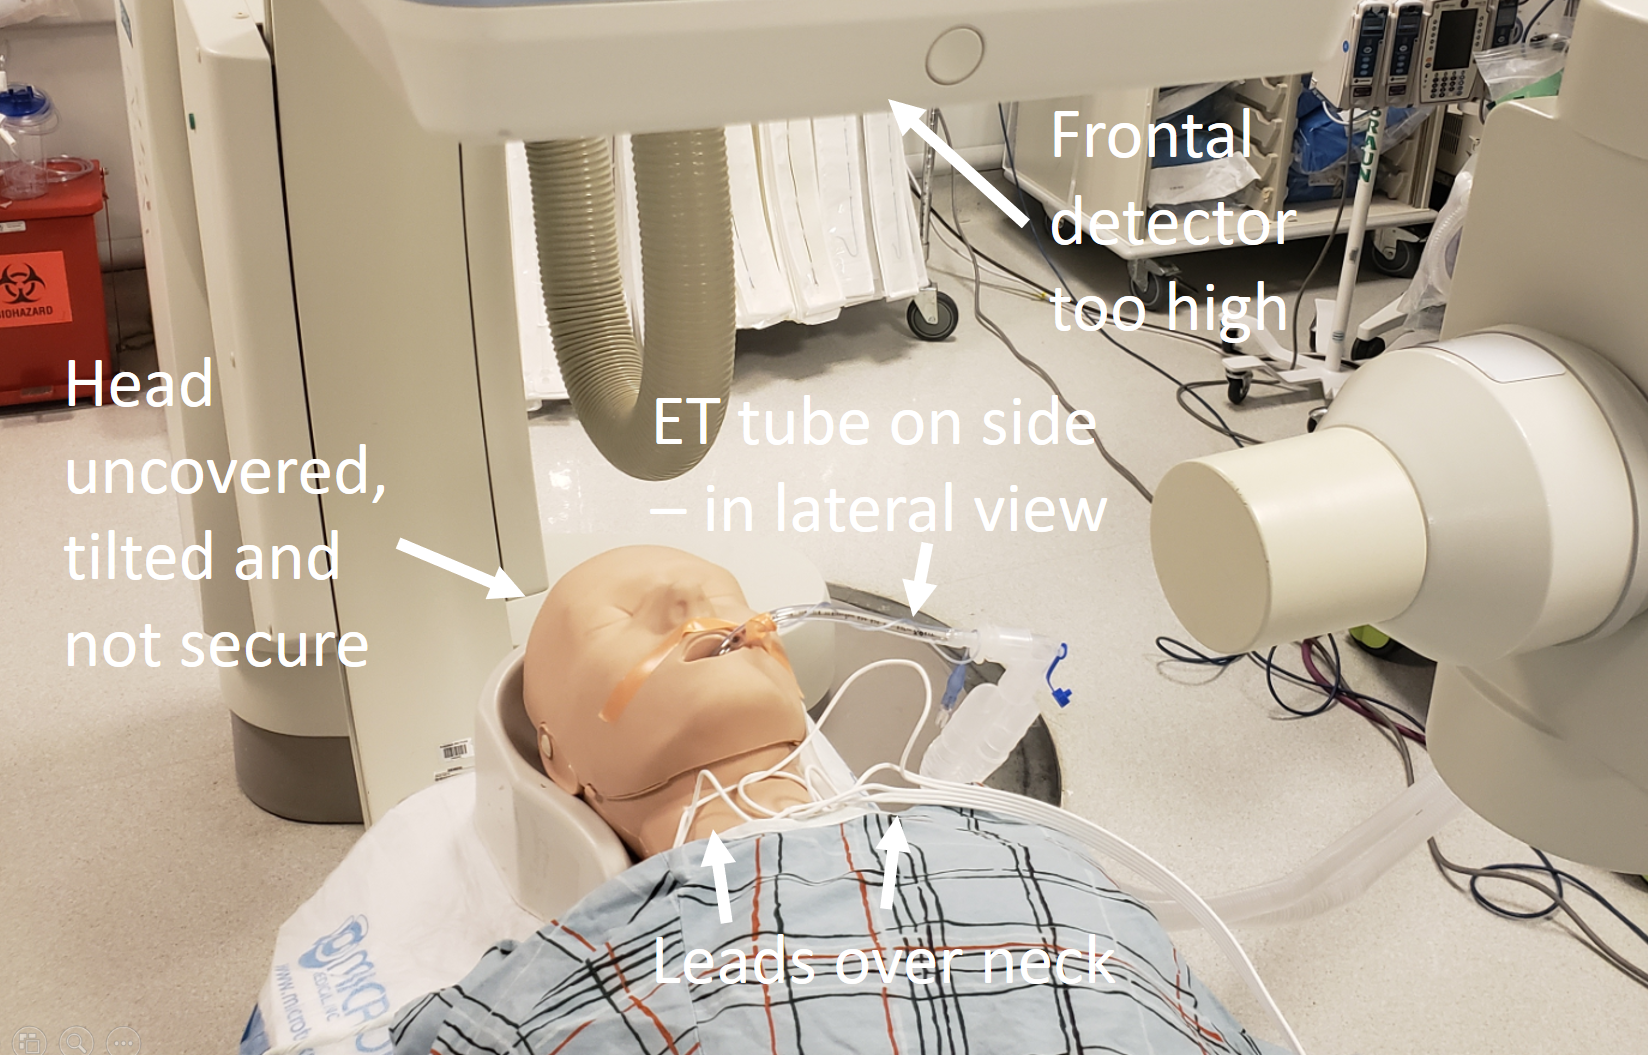
Below is an example of what not to do — various objects in the way, tilted head, etc.
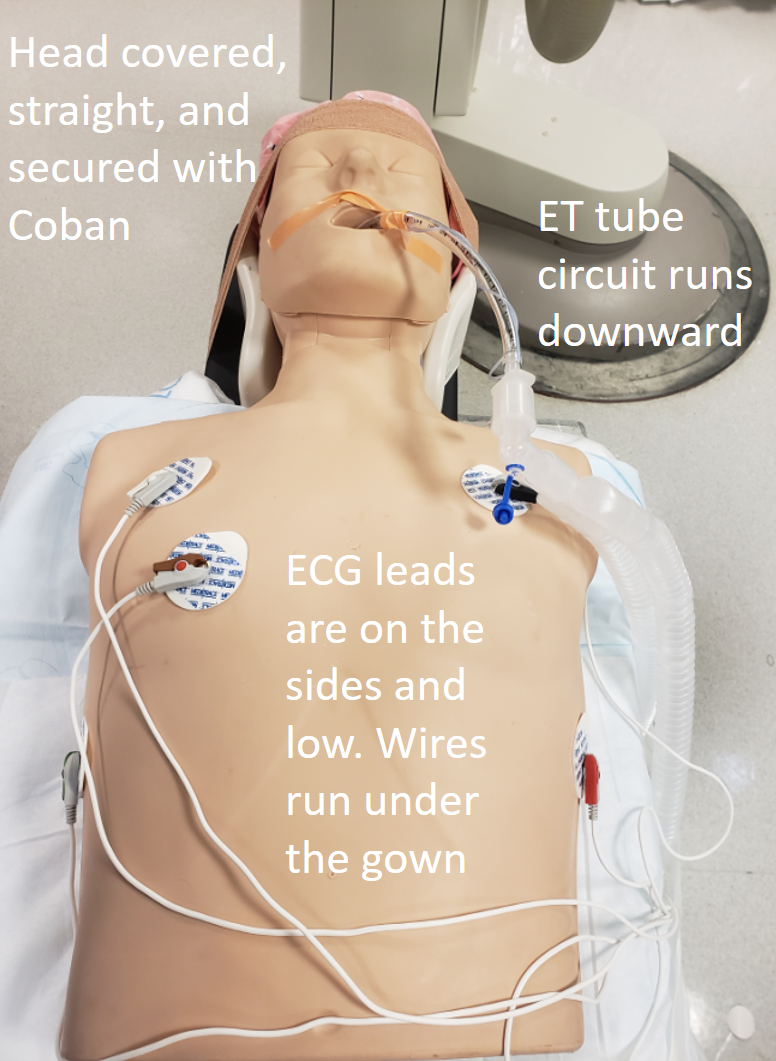
Below is the right way…
The reality is that if you are unwilling or unable to get optimal 2D images, then mastery of Cone Beam CT may not be for you. The whole team — whoever is in your lab — needs to be on board with this and dedicated to perfection, or it will not work.
Machine
Excellent cone beam CT images have been published for over 20 years, which means that machine is less important than patient and injection. You don’t need the latest and greatest, although having newer equipment helps. Particularly, protocols that do not have “binning” (averaging of adjacent pixels which sounds silly — why give up spatial resolution? — but has some advantages if one is not too picky about image quality) are optimal. In our experience, Artis Q consistently produces better DYNA CT images than Icono. Latest is not always best.
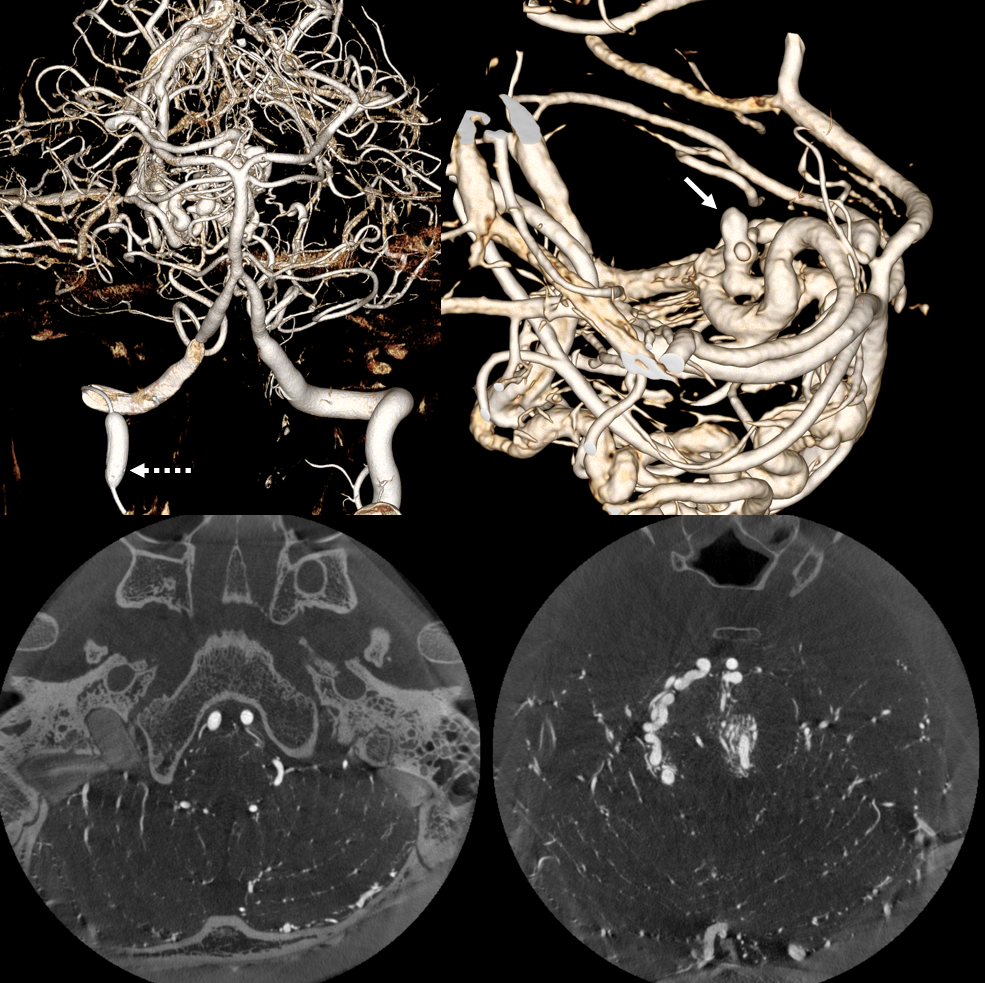
The most important factor in machine is calibration. If machine is not calibrated, you will see arcs and semi-circles instead of points.
Here is one example of bad calibration. You can see the image wobbling. Artis Q, 10 second binned (25 FOV), 3 cc/sec for 36 sec, 2 sec delay.
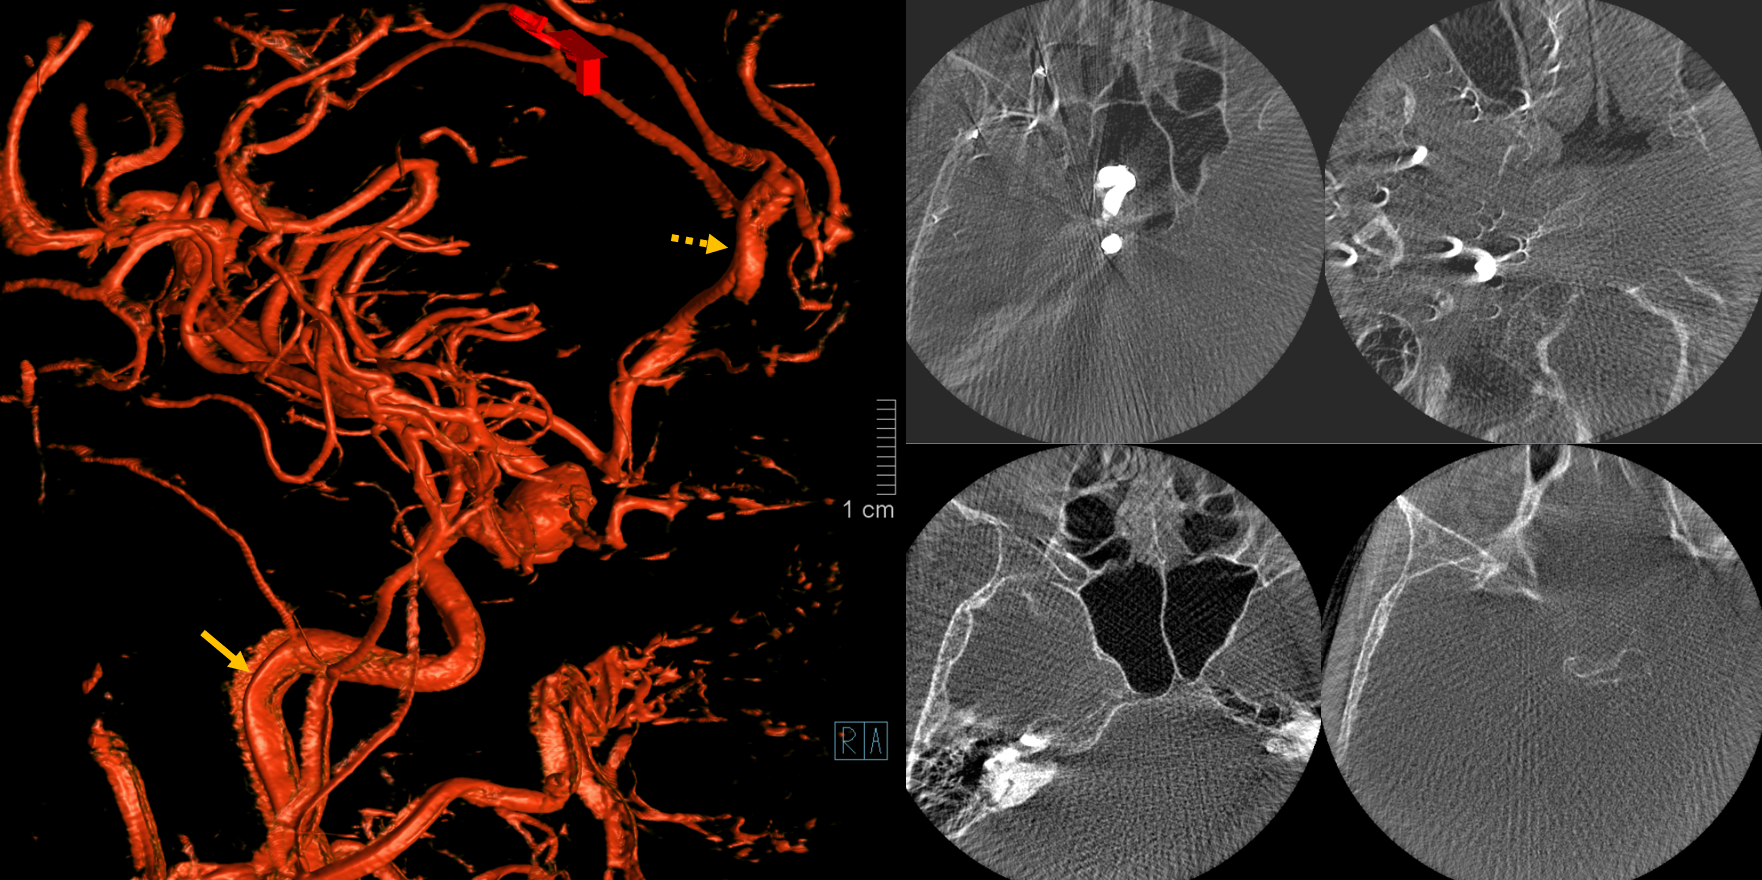
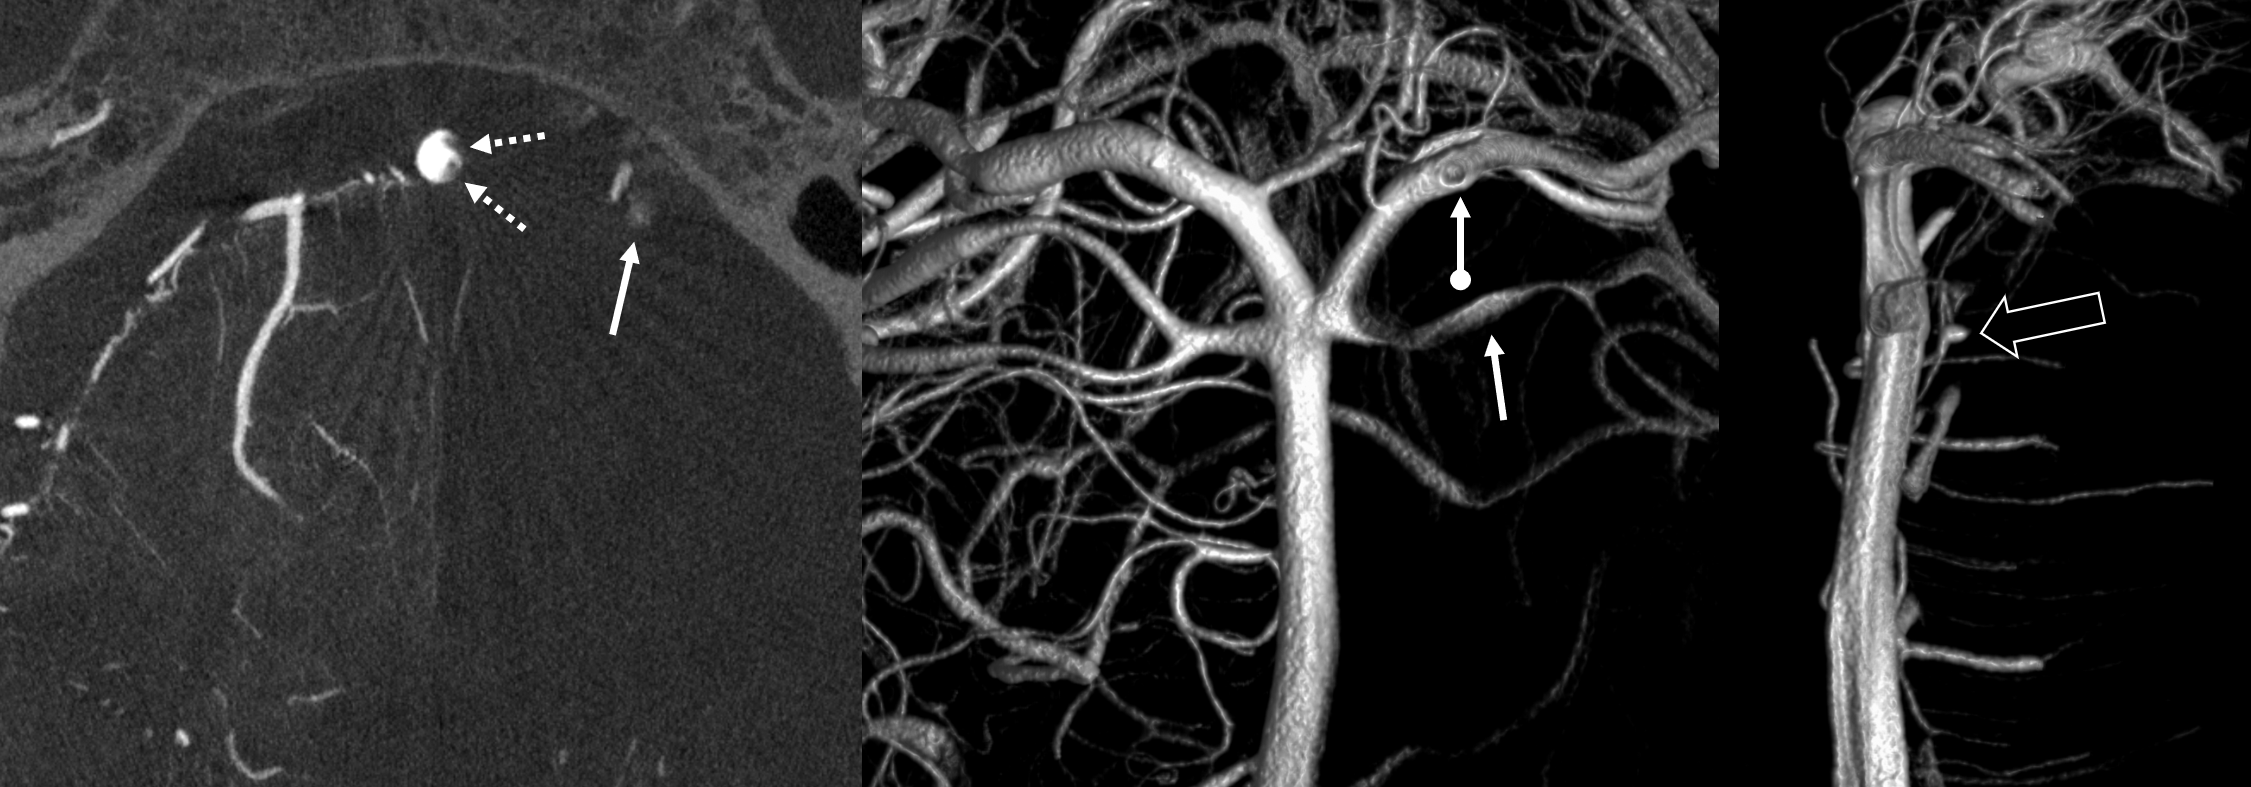
Result below. On MIP images, round objects look like arcs and semi-circles. On VR images, vessels are thicker in some projections than others (dashed arrow) and there are round small vessels inside wider vessels (arrow).
INJECTION
It is important that vessels of interest be opacified completely and homogeneously throughout the rotational acquisition. CBCT reconstruction is highly sensitive to inconsistencies. If a vessel is filled intermittently, a streak or star artifact results (its impossible to know where along the line of x-ray beam a point is if its not seen in the same position throughout rotation).
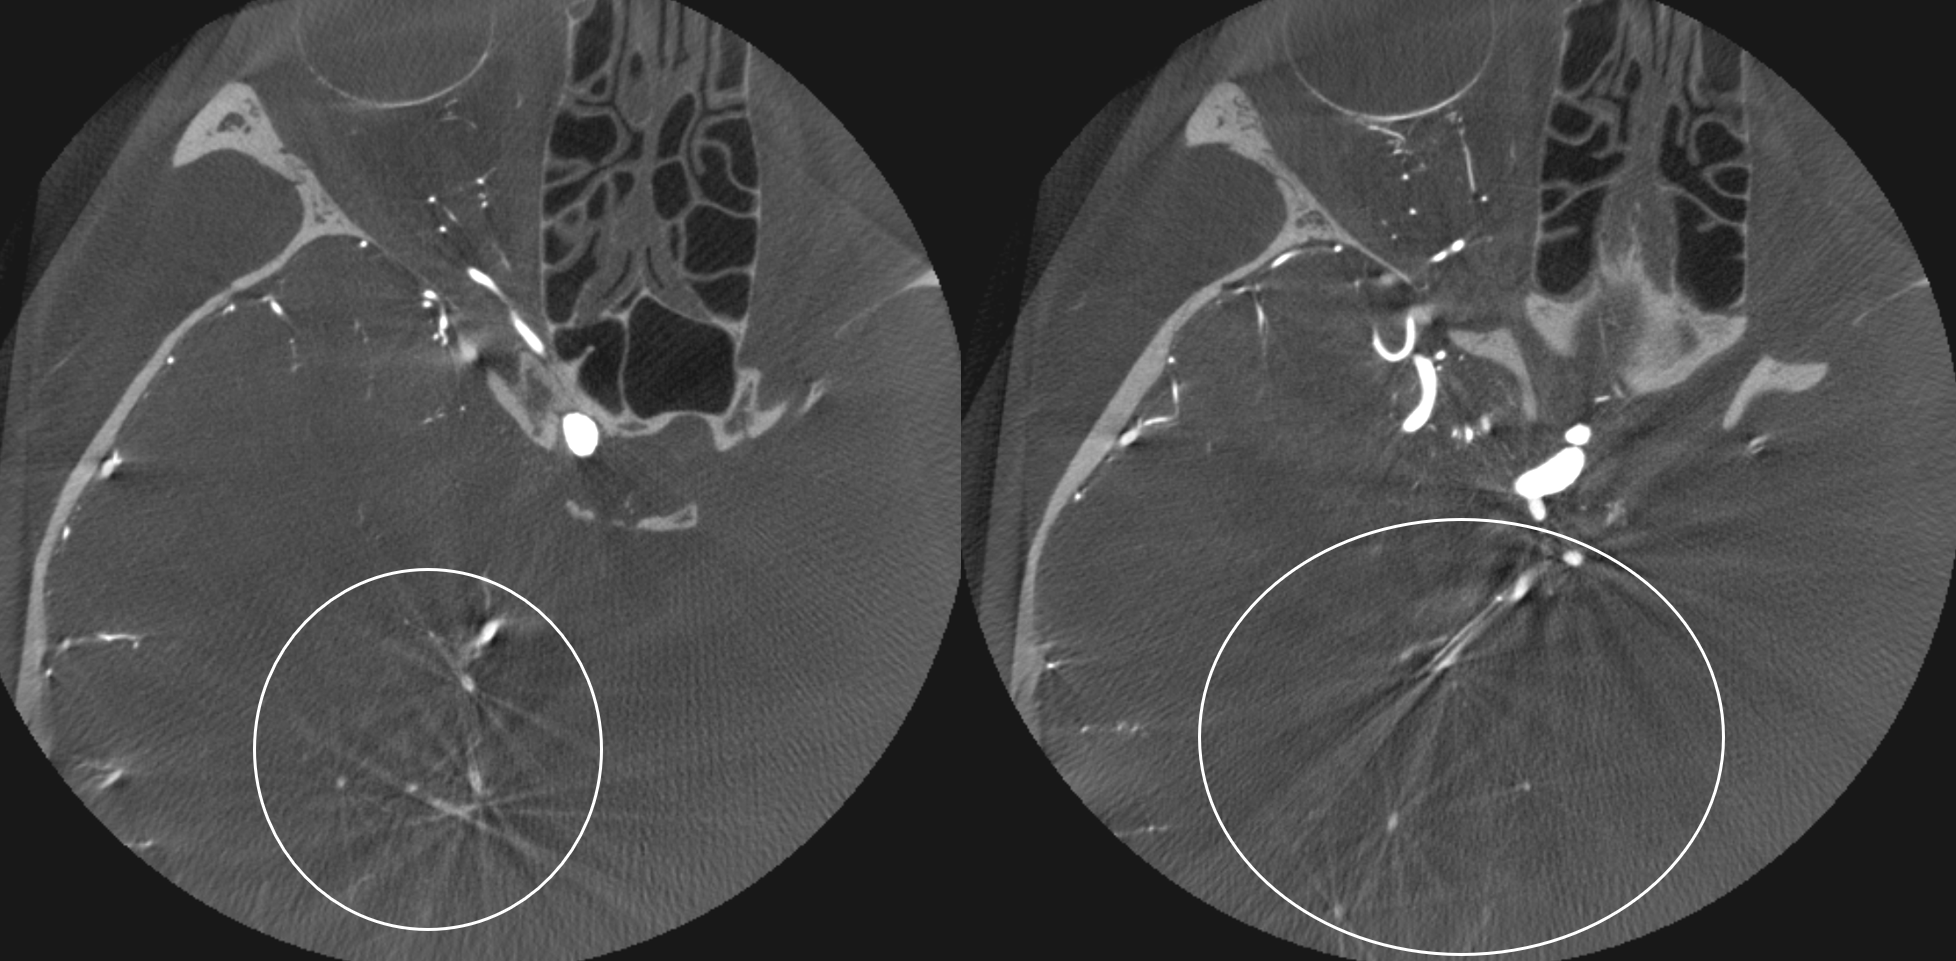
This is an example — there is consistent opacification of the ICA circulation, but intermittent filling of the PCA due to P1 inflow.
Siemens Artis Q, 10 sec DCT unbinned / micro, 22 cm FOV. Injection 3 cc/sec for 36 cc, 2 sec delay.
Note how reconstruction shows streak artifact in the PCA (circles) while the ICA territory is excellent.
Vertebrobasilar Circulation Imaging
One particular issue for both 2D DSA and 3D is visualization of vertebrobasilar circulation with unopacified inflow from the other vertebral artery. The situation is worst when vessel are co-dominant and the patient has good cardiac output. With weak output it is easier to reflux contrast into the other vert. Young healthy people are harder 🙂 Vasospasm can interfere also. The solutions are several — double catheter injection, higher rate injection into one of the verts (with care, of course), and temporary balloon occlusion of the other vert.
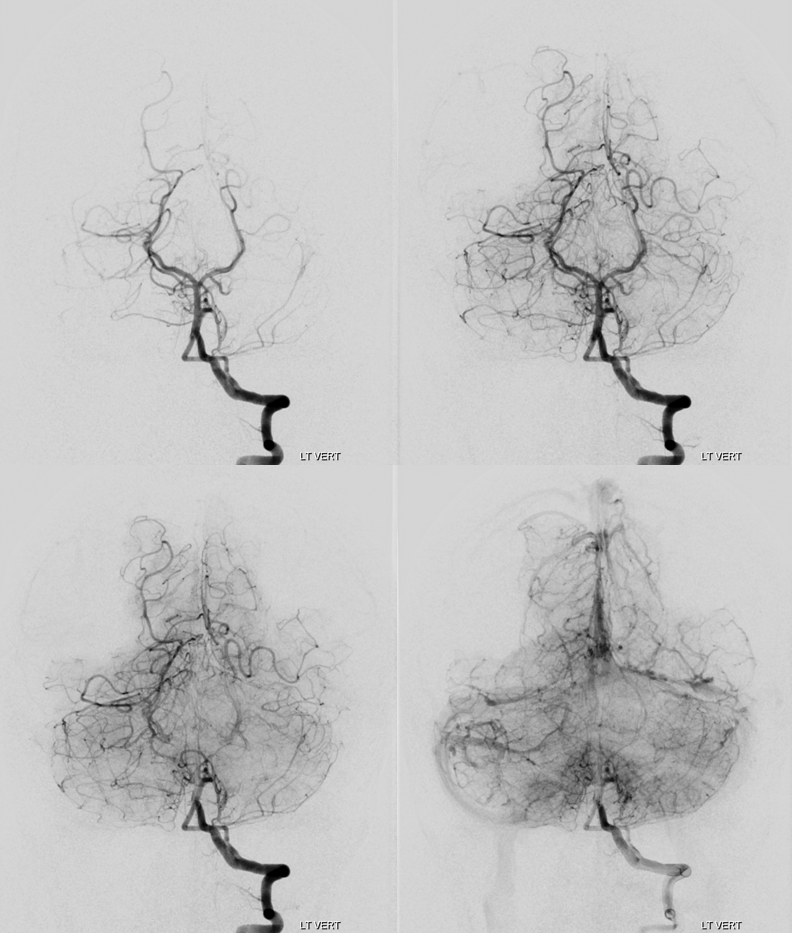
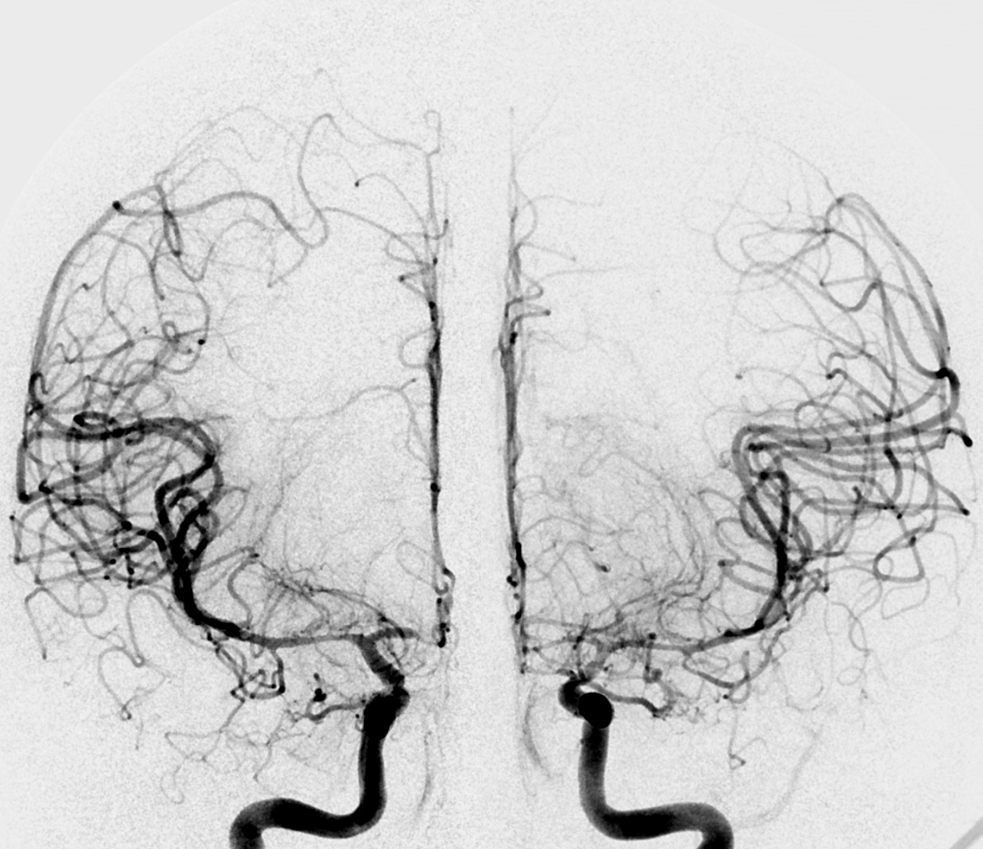
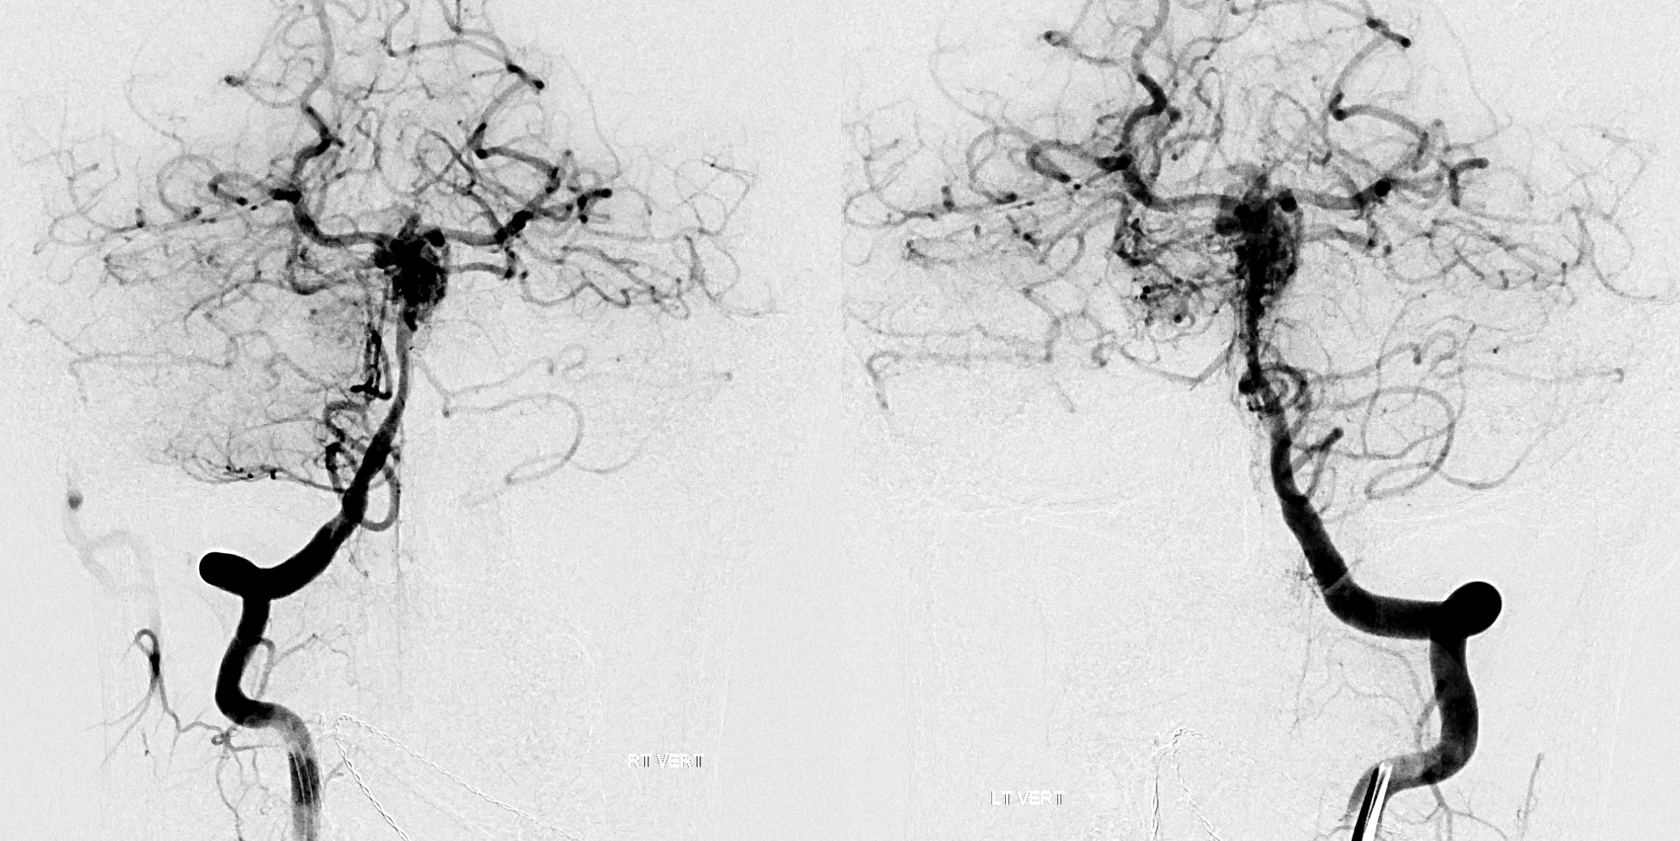
Below is example of a patient with extensive CTA negative subarachnoid hemorrhage. The verts are co-dominant. 2D-DSA injection shows intermittent filling of the basilar and distal circulations.
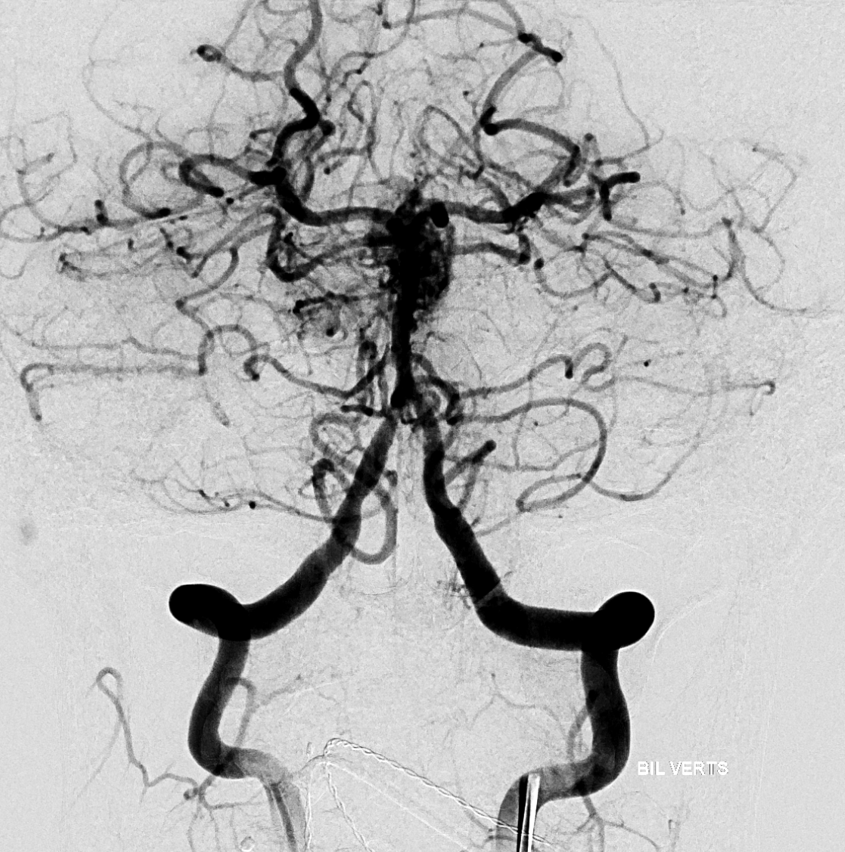
Therefore, the rotational angio needs to have enough rate to overcome it. Therefore:
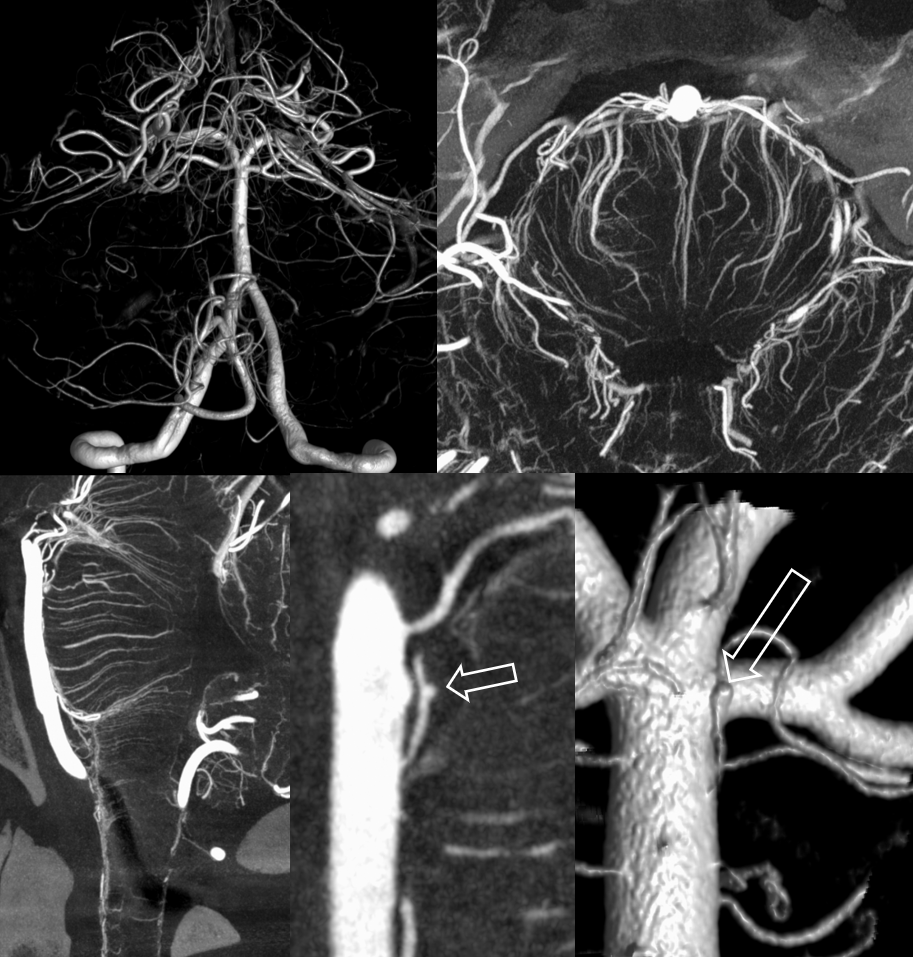
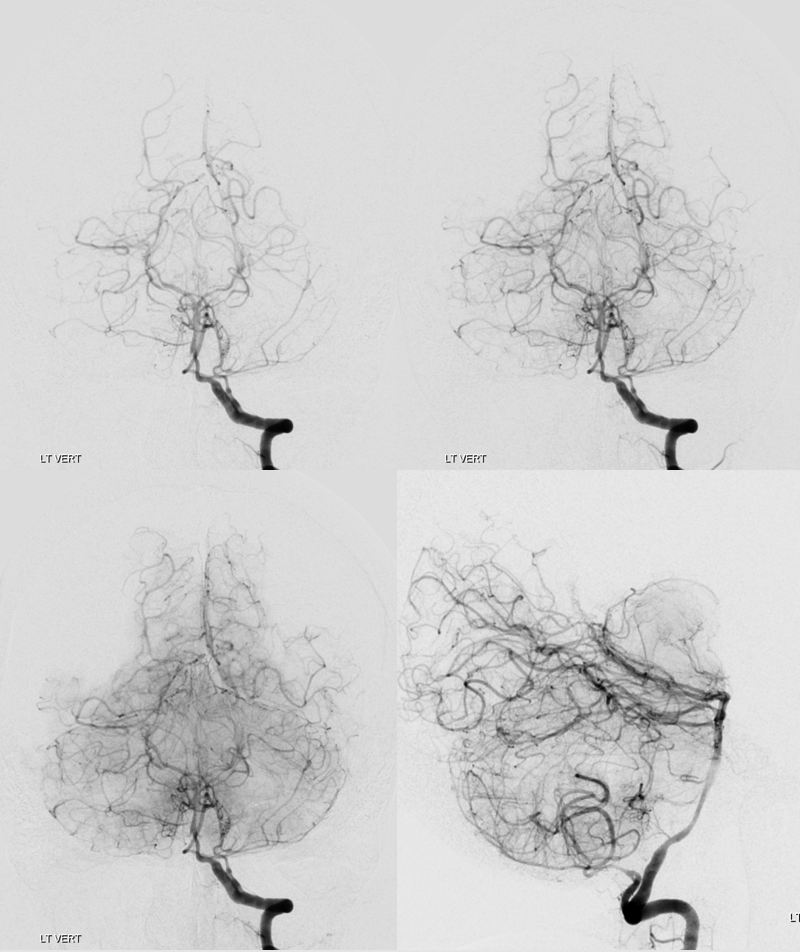
Siemens Artis Q, 20 second “micro” unbinned 22 cm FOV DYNA. Rate 3.5 cc/sec for 75 ccs, 2 sec delay. It is a higher than usual rate for the vert and should be done with care. Make sure the catheter is not subintimal and there is no spasm. Note excellent reflux into the right vert
This results in excellent images, allowing for diagnosis of a basilar perforator aneurysm (open arrows). Yes, its real, and that’s why she bled. Here is some literature.
Ten days later, the patient returns for follow up angiography. There is no clinical suspicion of vasospasm. Nevertheless, there is pretty impressive angiographic spasm present — yes, tiny basilar perforator aneurysms can do that. She is also by now shunt-dependent.
Left vert injection — due to worsening distal left vert spasm it is now harder to overcome the inflow from the right
Siemens Q, 10 second “micro” unbinned 22 cm FOV DYNA. Rate 3.5 cc/sec for 40 ccs, 2 sec delay. Despite higher rate, the right vert inflow cannot be overcome.
The result is predictable. Laminar contrast flow in the basilar (dashed arrows) favors the right side from left vert injection, as is often the case. There is amazingly less opacification of all left-sided perforators, poor visualization of the left SCA (arrows), and unopacified contrast inflow via the PCOM (ball arrow). Nevertheless, there is enough data to show enlargement of the basilar perforator aneurysm (open arrow. Any doubts about this aneurysm now?)
Is this a problem in need of solution? Sometimes yes, sometimes no. We did not need to do anything special in the above case — the aneurysm is well-seen anyway (fortunately the branch origin is more on right side of basilar).
Co-Cr visualization?
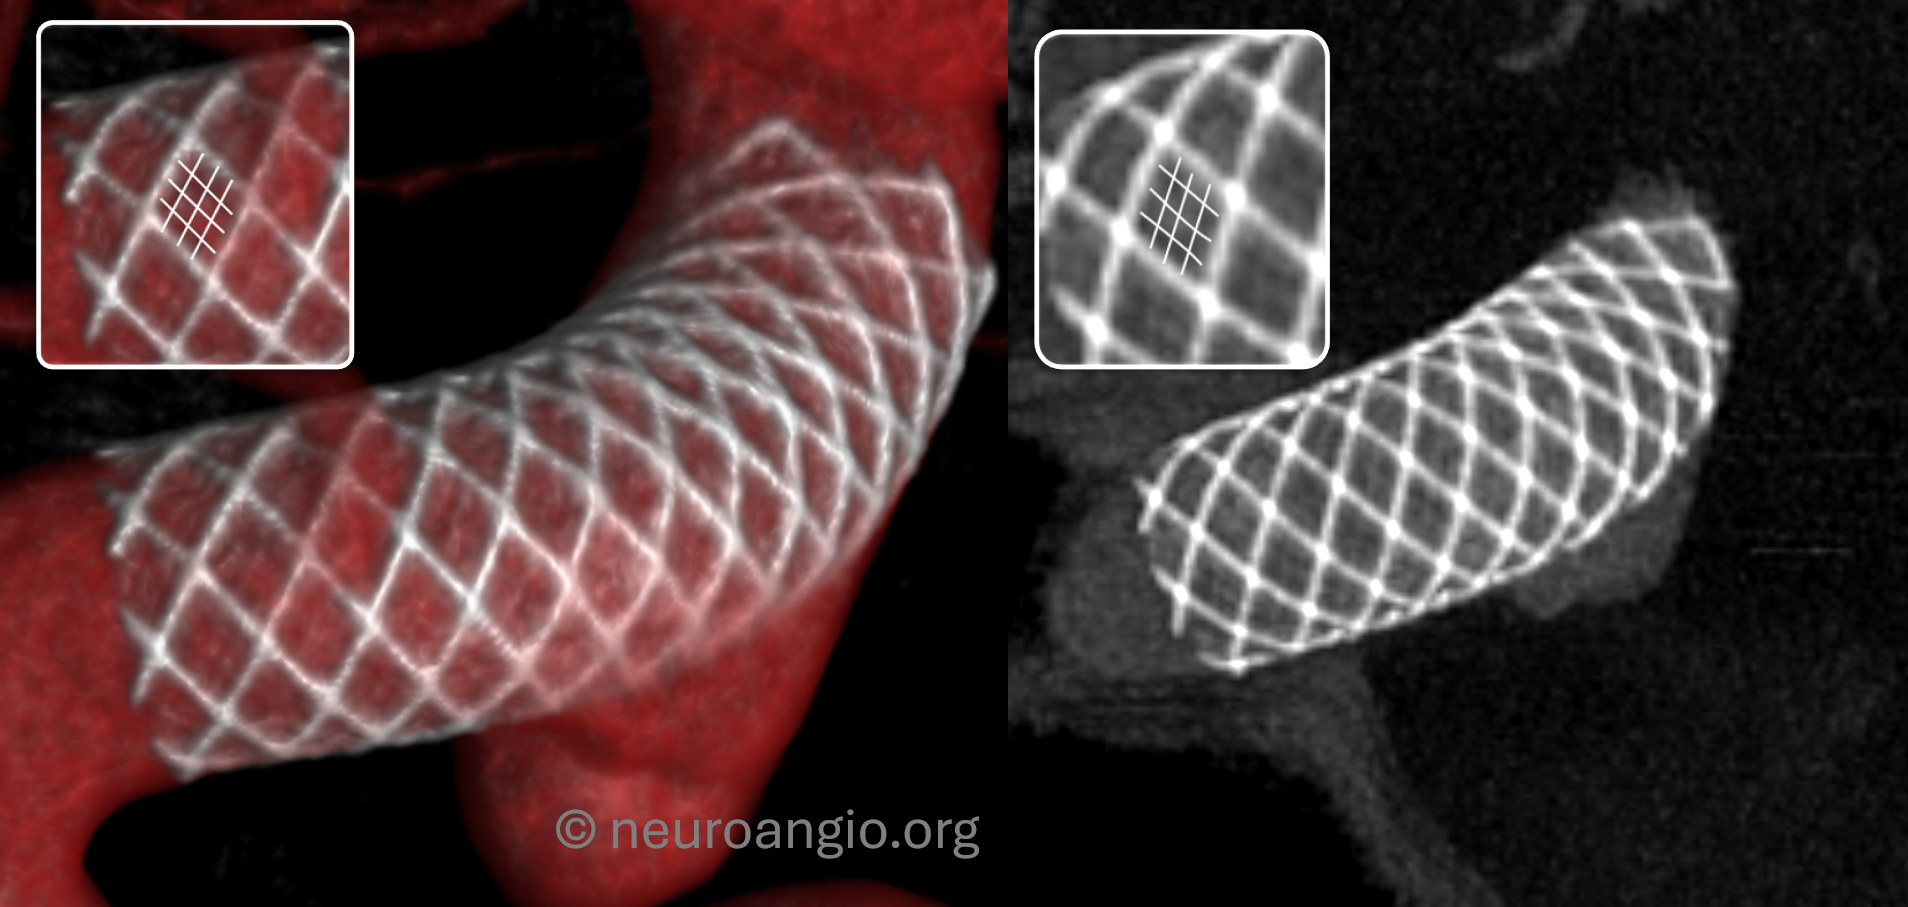
One test of you DYNA imaging quality is to look for faintly seen non-platinum Co-Cr braids of the Pipeline Shield. In the top quality images, you can begin to see them in some areas (drawn for clarity in the insets below). That’s truly amazing — to pick up a non-radiodense alloy like Co-Cr (got Ni there also and other things they don’t tell you about).
Below are the “SUPERDYNA” and MIP images of a standard small superior hypophyseal aneurysm post Pipeline Shield embolization (see full case here — including how to get these images). You can faintly see the Co-Cr braids on both VR and MIP images (insets show what we are looking at — three Co-Cr braids for each Pt)
The same applies for the WEB. The larger WEBs have thicker braid and are easier to see. Small ones can be hazy.
Centering
It is extremely important that the object of interest be placed in the exact center of the detector. For example, just as with the Pipeline, the litmus test for WEB is whether we can see different density Platinum braids. With centering the web, 20 sec “micro” unbinned 22 FOV protocol the results are optimal. Full case here
kEv –70 vs 109?
The general radiology principle is that “harder” higher frequency x-rays (109 kEv) are best for maximizing spatial resolution at the expense of contrast resolution, while softer (70kEv) ones are better differentially absorbed in tissues of different densities, thereby having better contrast resolution at expense of lower spatial one. There is never ever free lunch in physics.
In practice, the differences are minimal for CBCT I think, and many other reconstruction and rendering factors play roles in how the final image looks. Still, looking at the below, you can se the braid slightly better in the 109 kEv image. Full case — with discussion of superDYNA vs dilute DYNA is here.

Homogeneity of Injection — The Unopacified Vert Problem
What about the case below? Its a complex ruptured brain AVM. We need to see it well. Still, both verts do not give optimal imaging on 2D-DSA
Its important to see this well. Bilateral injections are the solution
However, its more contrast to inject for rotational. Instead, balloon is inflated in the right vert and rotational is done from left.
Siemens Icono, 7 sec DCT (single spin) unbinned / micro, 22 cm FOV. Injection 3 cc/sec for 30 ccs, 3 sec delay.
MIPs and VRs are excellent, showing the culprit perinidal aneurysm (arrow)
CONTRAST CONCENTRATION
One question coming up all the time is what contrast concentration to use. The answer depends on the goal of CBCT.
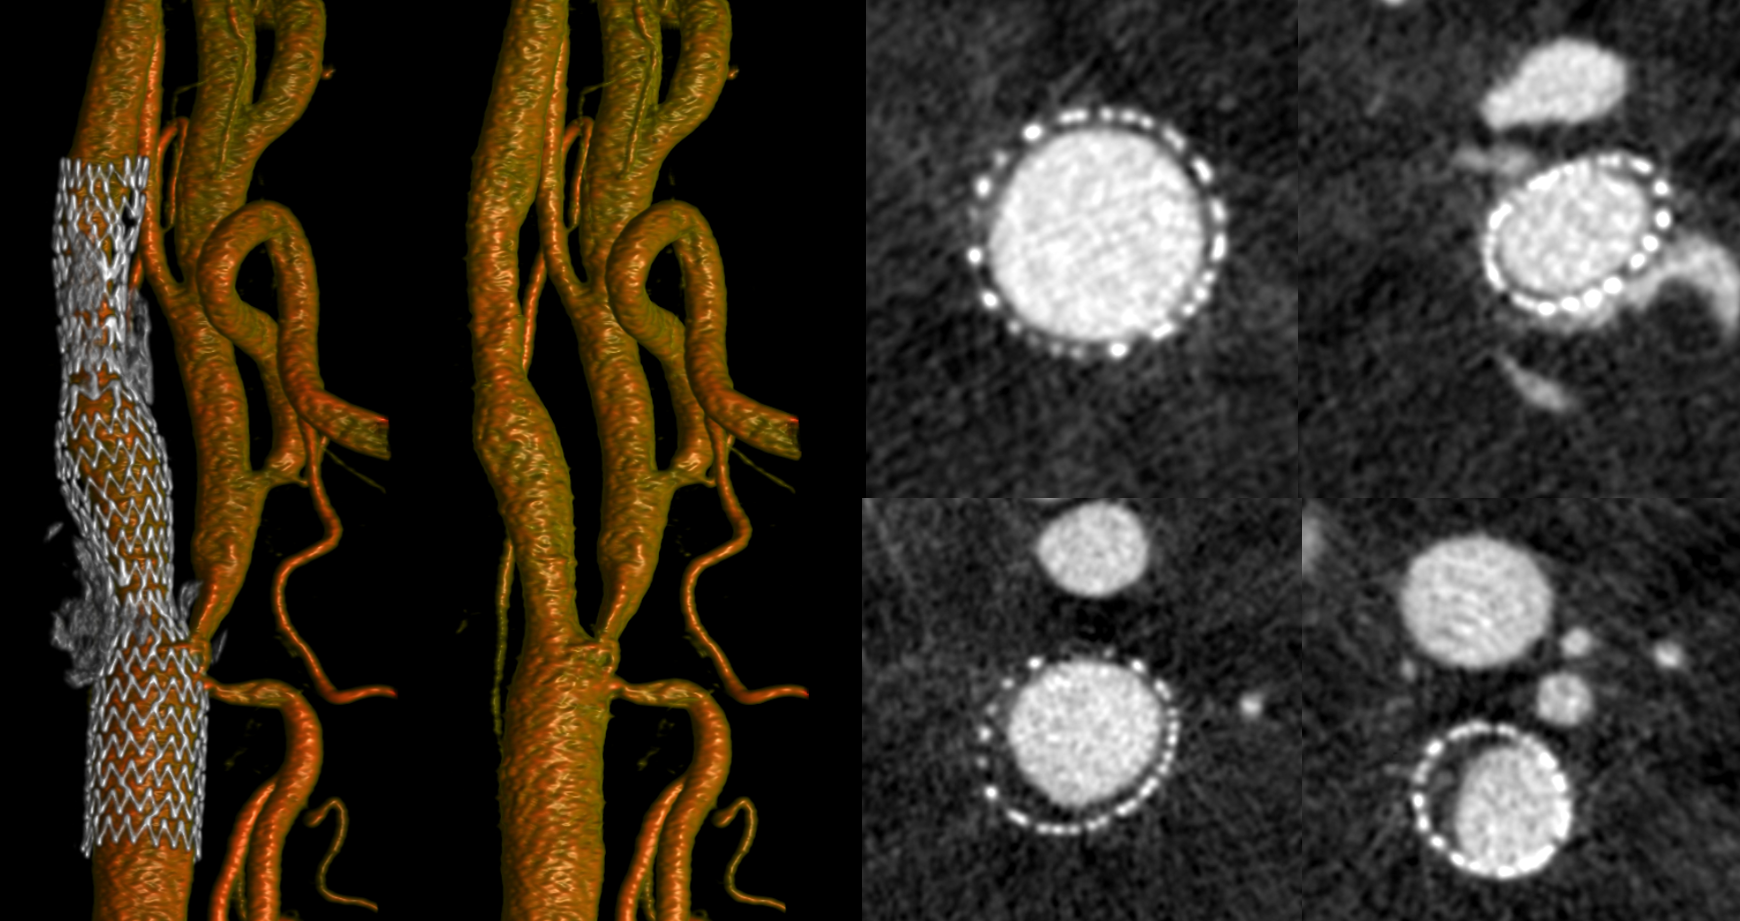
The most consistent way CBCT is now used is in post-flow diverter evaluation. That’s a tiny amount of CBCT power, but its a start. For this, it is recommended to use very dilute (10-20%) contrast and look at MIP images for device malapposition etc. This makes for good MIP images of large vessels. However, small vessels are not well seen, and Volume Rendered (VR) images are very suboptimal. Below are MIP examples of low contrast concentration images for evaluation of Pipeline device apposition. The very best quality images can visualize the normally invisible Co-Cr braids in-between the Pt ones. Full case here.
What about all other applications — the ones we are showing. Evaluation of AVMs, fistulas, tumors, etc. Should dilute contrast be used there as well? The answer is not so clear, and depends on machine and contrast type. In some settings, too concentrated contrast produces streak artifact. We do not find it to be a problem with Siemens Q and Icono.
In our experience, getting optimal volume rendered images requires 80-100% contrast. That’s what we use. This means between 20 and 80 mls of contrast per acquisition in typical adults. As long as there is no renal insufficiency that is ok in our experience. If the goal is to get good VR images, that’s what it takes. We do that also for flow diverters and get dual volume imaging, like this.
Dorsal wall / “blister” ruptured aneurysm, post PED Rx
If there is concern for renal insufficiency that’s mild, dilution up to 33% can still produce pretty good VR and MIP images. Its a pretty decent compromise for large vessels, but VR images are not as good as can be. Homogeneous opacification is key here, so choose higher rates.
Siemens ICONO, 7 second micro DSA DCT (two spins, mask and fill), 4.5 cc/sec, 36 cc total, 1.5 sec delay, 33% contrast concentration. This means about 12 cc of contrast total used.
Artifacts and Pitfalls and Other Details
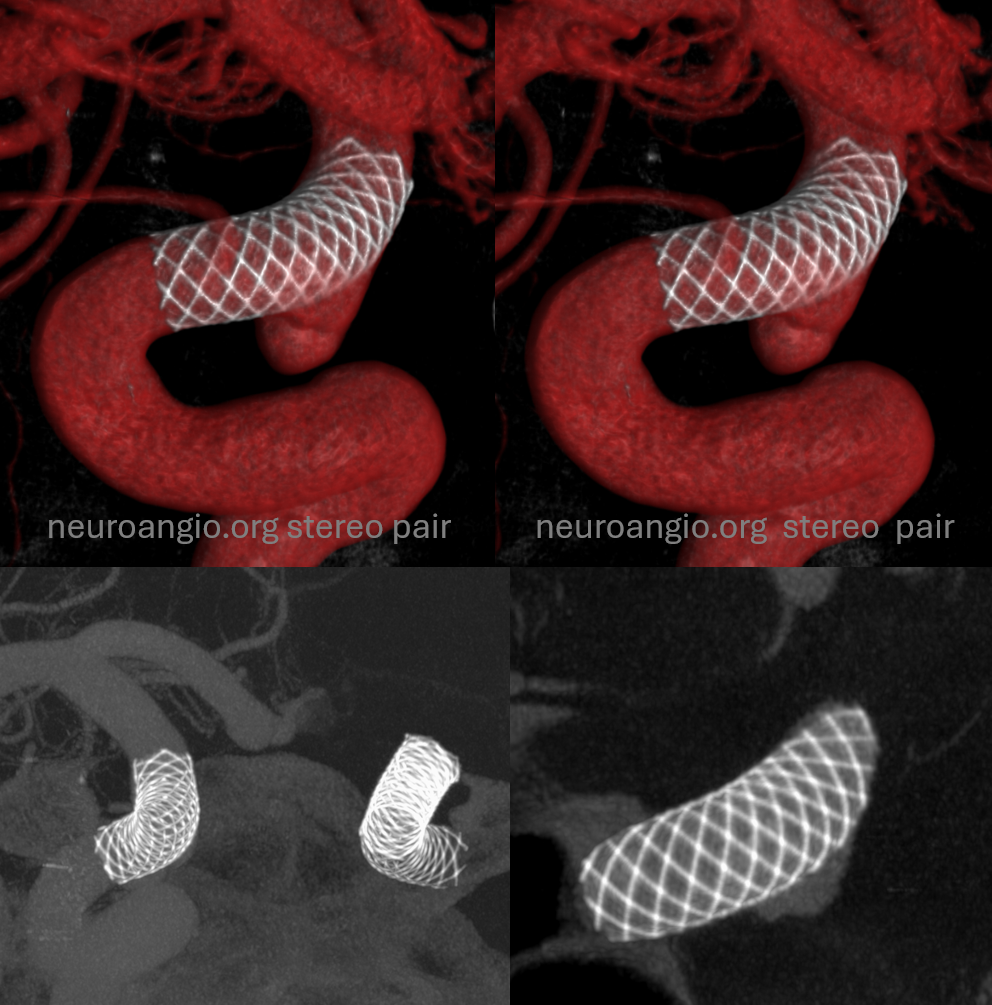
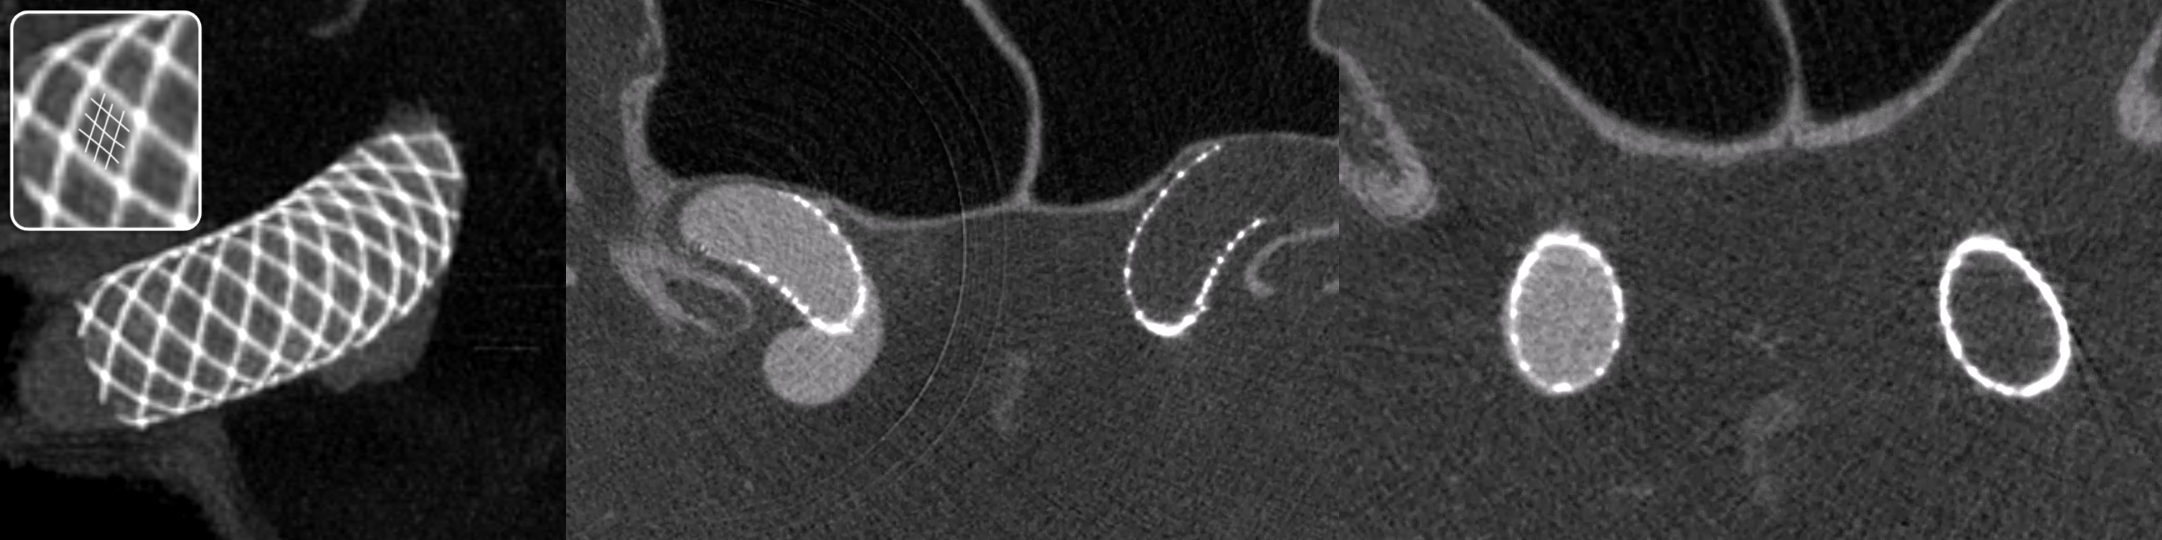
One common artifact is poor Volume Rendered reconstruction of vessel after stenting — when the stent is located parallel to the camera. In the example above (carotid stent), the beam rotates around the stent and the metal density is similar throughout — thus no major artifact. If a stent is placed in parallel to xray beam however — say in the M1, then the metal density will vary a lot depending on the angle. Artifact will be produced. As below — see poor reconstruction of the M1 proximal to Onyx
Even MIPS are not so good — there is an artifactual stenosis (arrows) proximal to Onyx in addition to poor M1 reconstruction in VR (dashed arrow). 2D images in top row are less prone to artifact and show extremely mild stenosis

Obtaining CBCT Images Awake
It is possible with very cooperative patients. It is best to obtain CBCT either in completely awake and cooperative patients or in fully asleep GA breathold pharmacologic paralysis ones. In-between is usually bad — moderate sedation, monitored anesthesia care — basically anytime there is sedation where patients rhythmically move, snore, etc. — and can’t follow directions — does not work.
For awake patients, shorter acquisitions are best. Currently the best one is the 4 or 5 second “micro” unbinned protocol with 22 cm FOV
Below is Siemens Icono, 4 sec “DSA DCT” dual volume unbinned 22 cm FOV “DYNA”. Contrast Ultravist diluted 70% contrast, injection 3 cc / sec for 18 ccs with 2 second xray delay.
You can see that the patient is holding very still — not as still as GA, but good enough
Reconstruction original
Secondary reconstruction small FOV
For reference, below is immediate post Pipeline implantation video obtained 12 months earlier unger GA
Note change in dimensions of the Pipeline — foreshortening AND diameter expansion. This is a process known as “positive remodeling” — extremely important. This is how the body presves vessel caliber by outward remodeling of the wall
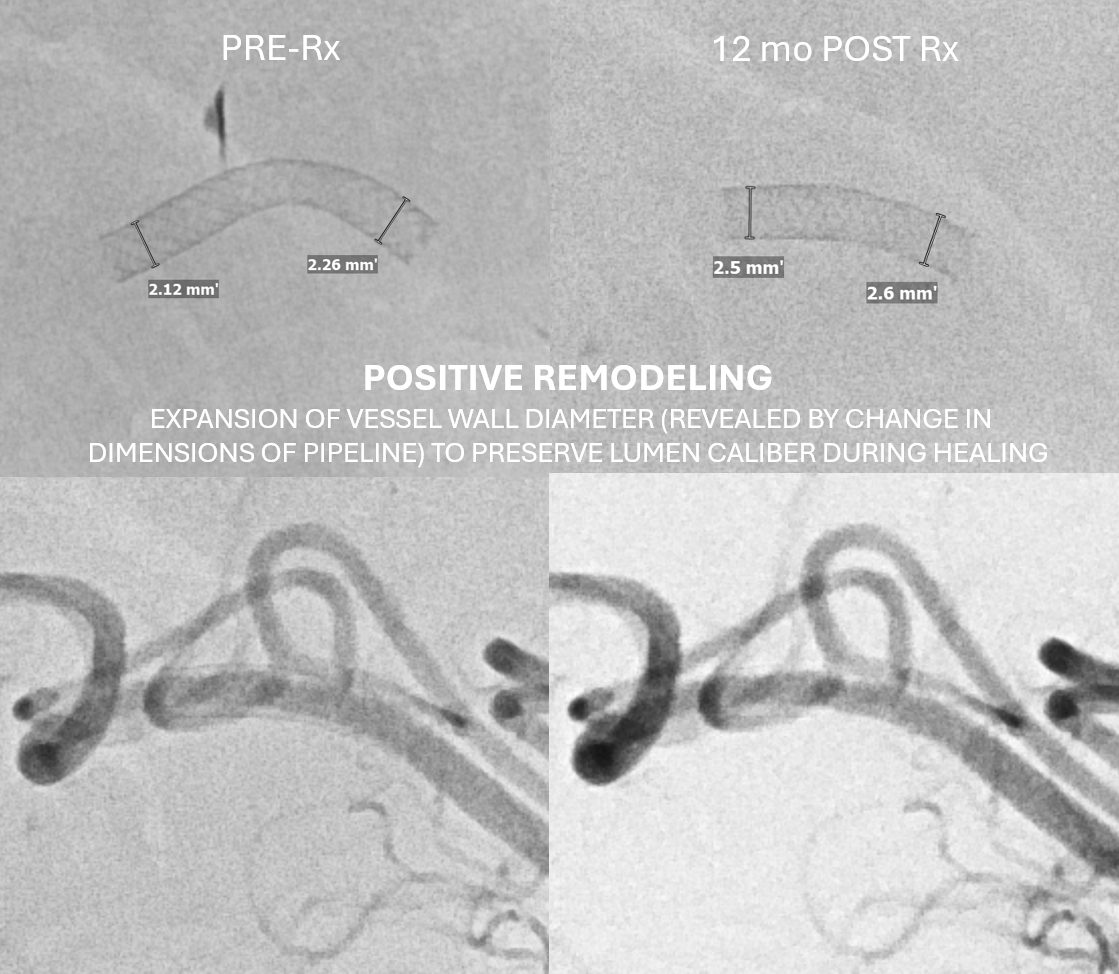
More on this process in our publication here
Back to CBCT Principles and Practice Page
How to Obtain Excellent Images Spine Page